Have you ever wondered whether the government was spending enough on transport? Or whether your governorate got its fair share of public expenditure? Or how strong national policy favoured New Cities?
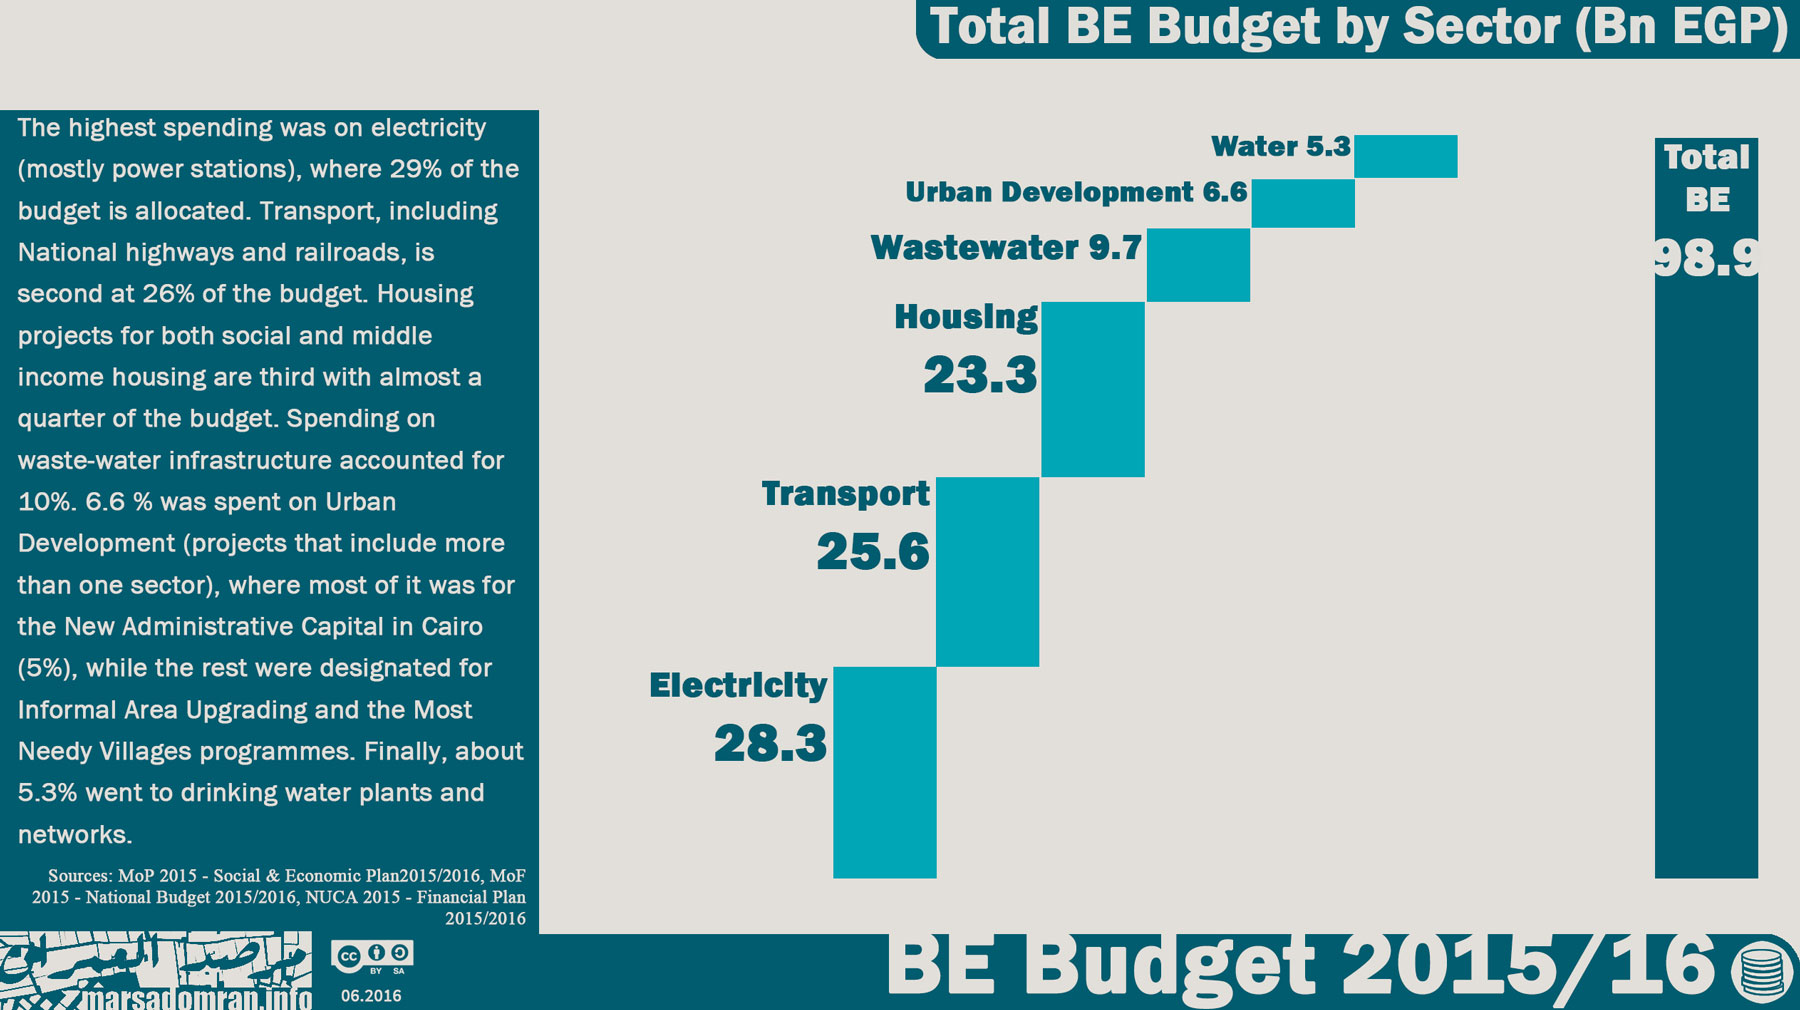
The Built Environment Budget FY 2015/16 | An Analysis of Spatial Justice in Egypt, seeks to answer questions on public spending in the built environment sectors and analysing spatial justice of public investments at the regional and governorate levels in six sectors that make up Egypt’s built environment: housing; urban development; water; waste-water; electricity, and transport. Budget data for these sectors was gathered on four ministries, 27 governorate directorates and 14 State-owned Enterprises totaling 98.9 Bn EGP, which translates to a per capita spending of 1098 EGP per person.
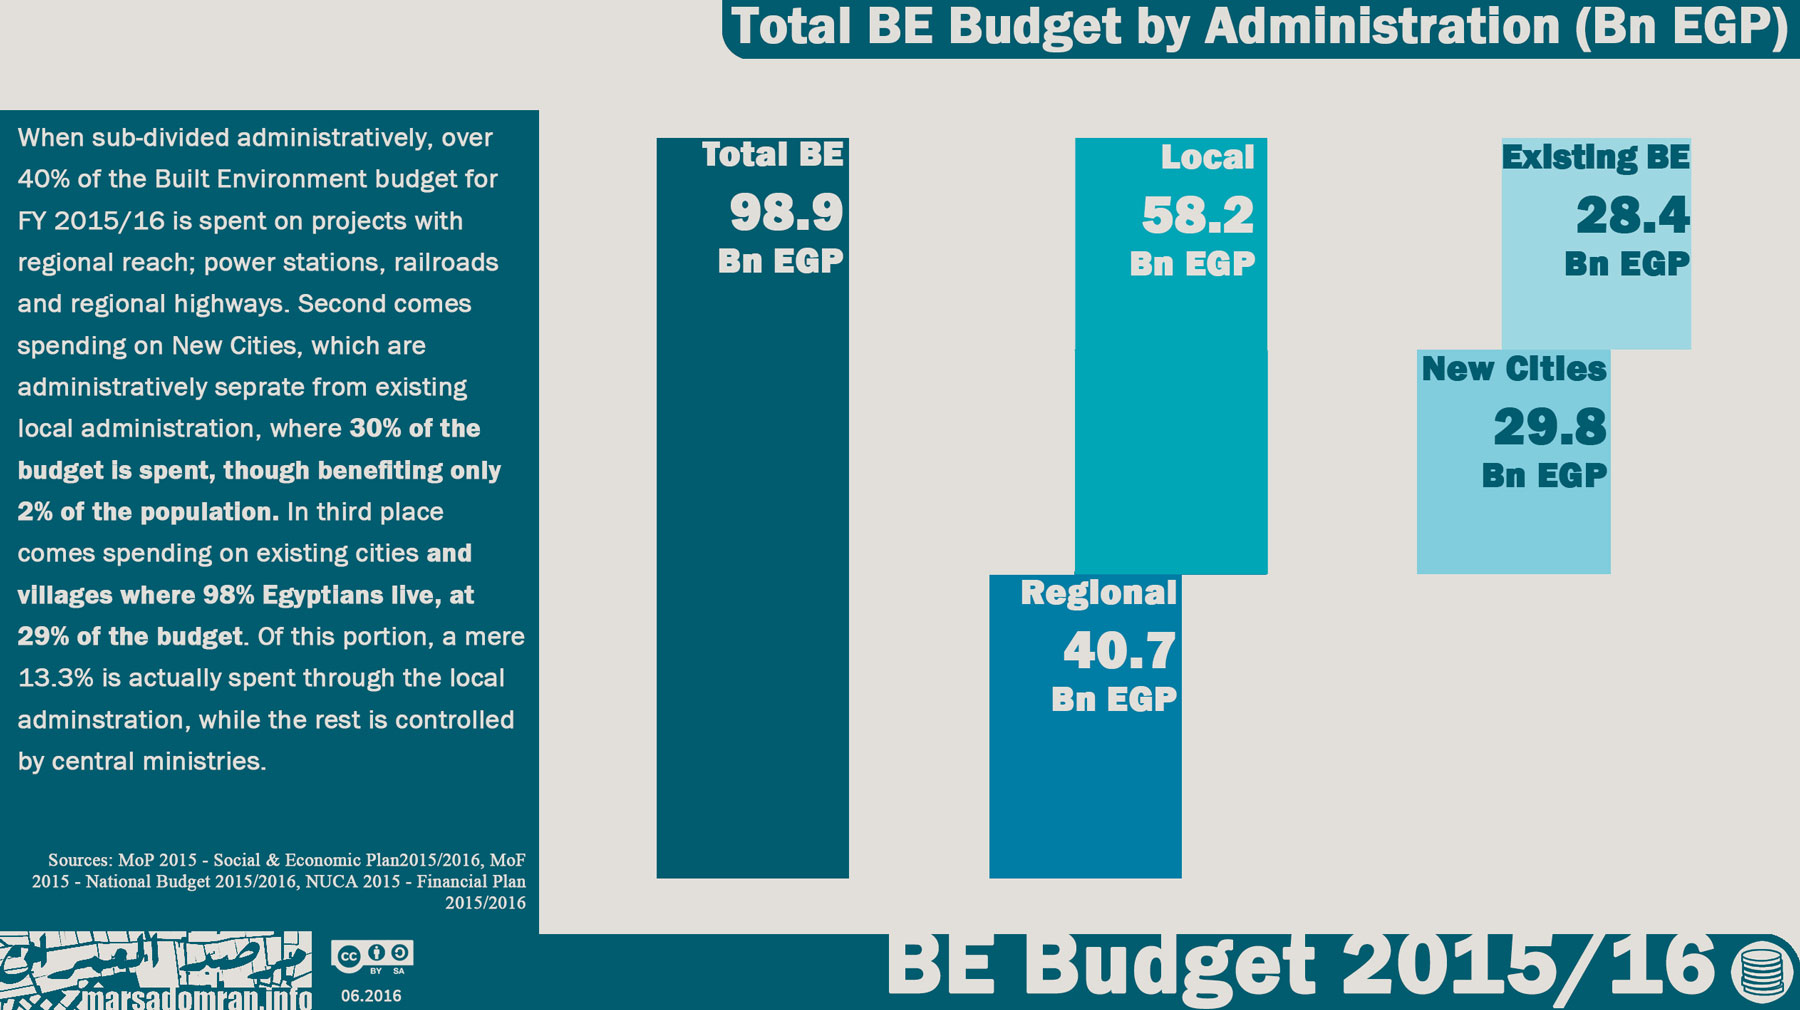
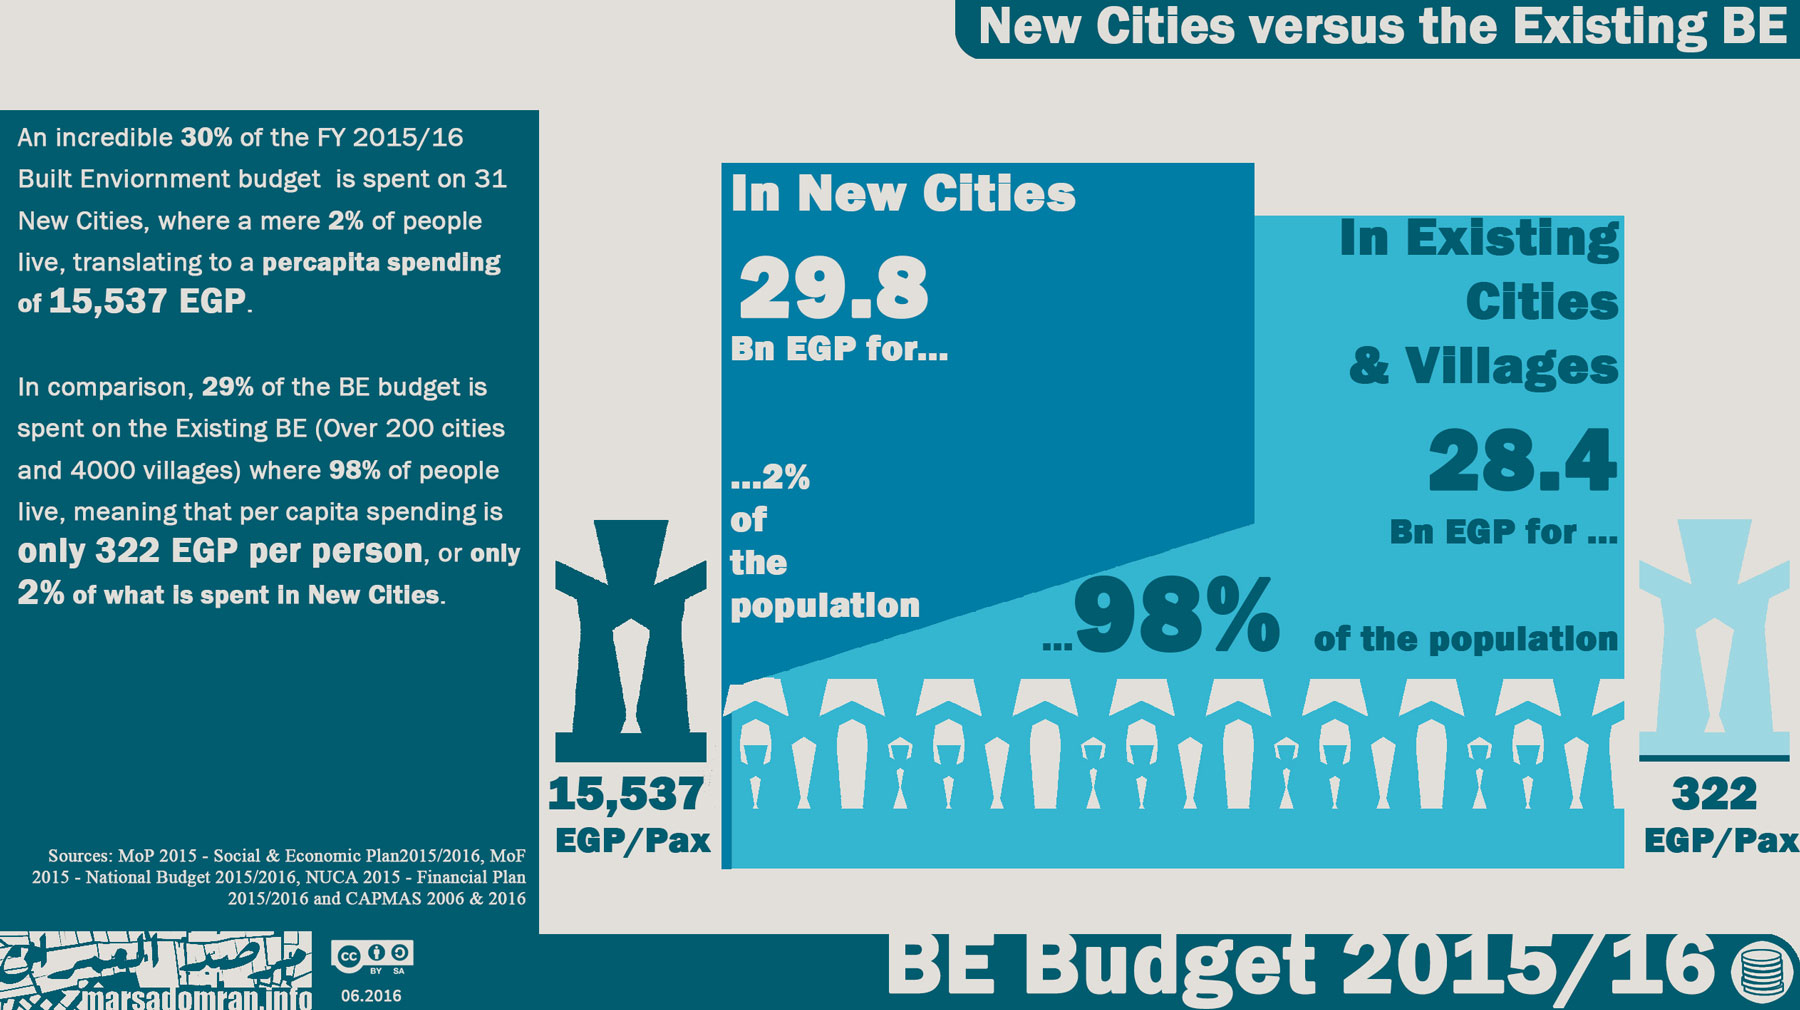
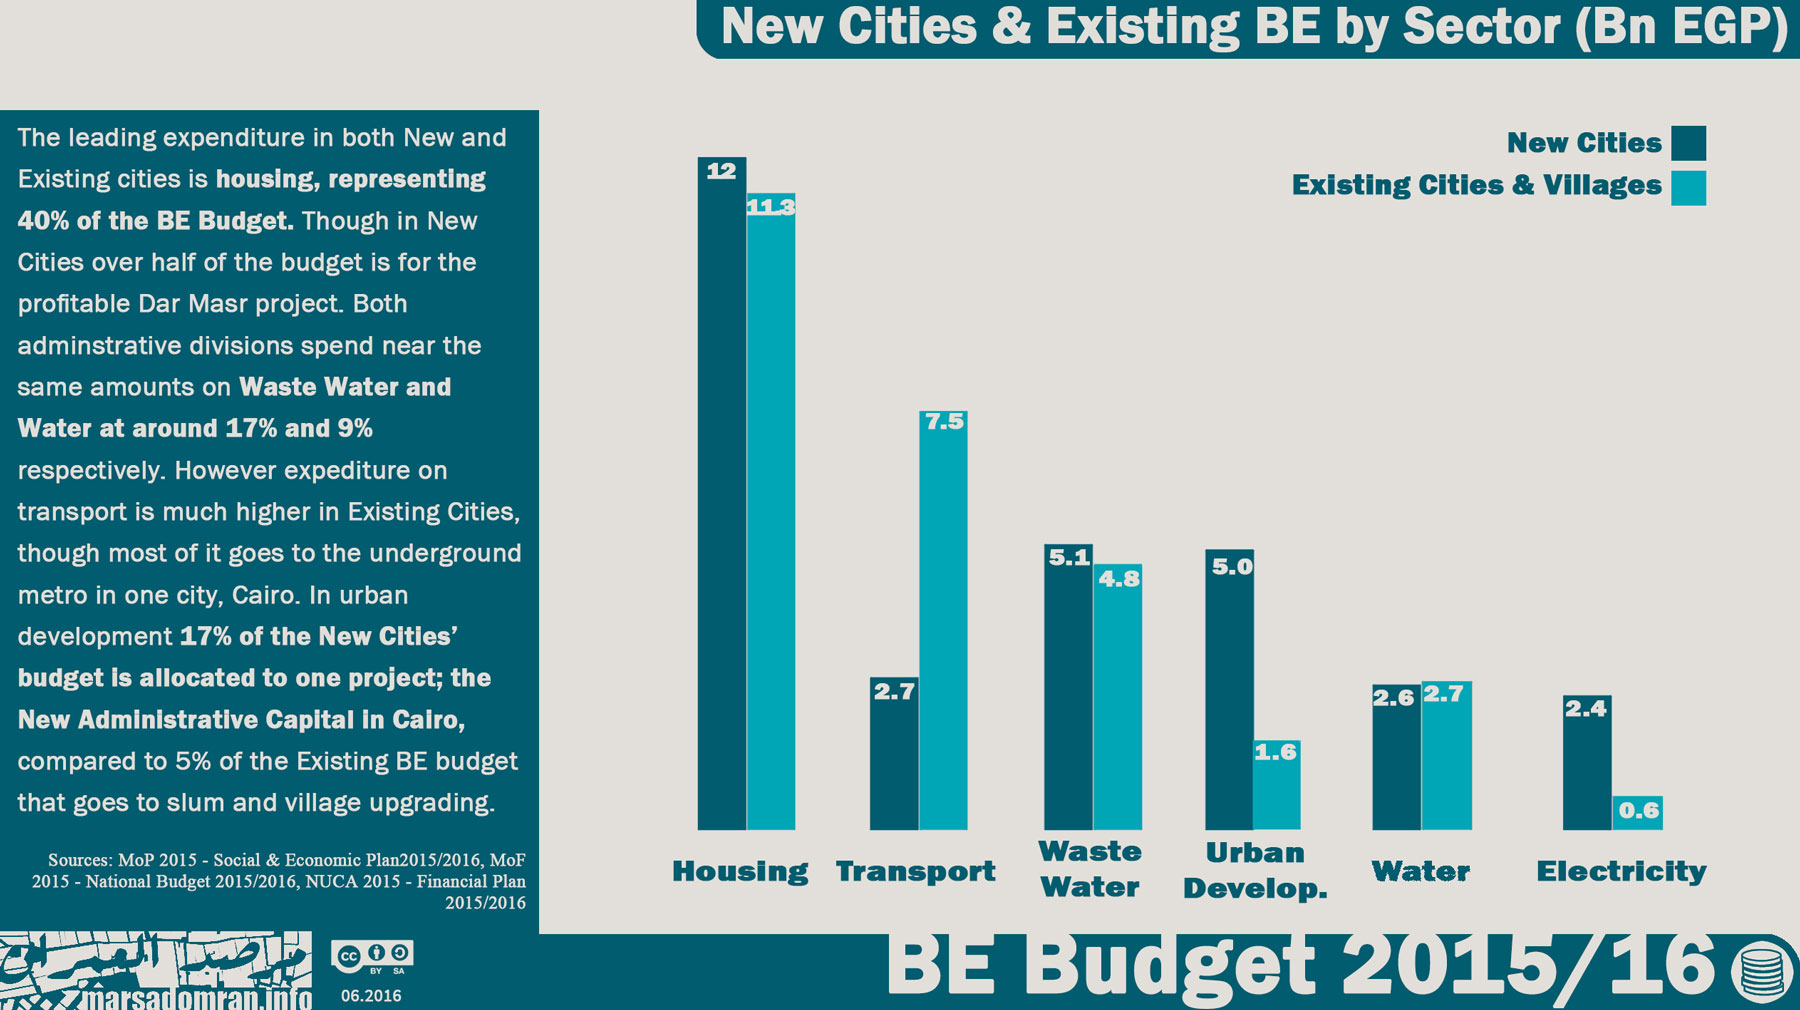
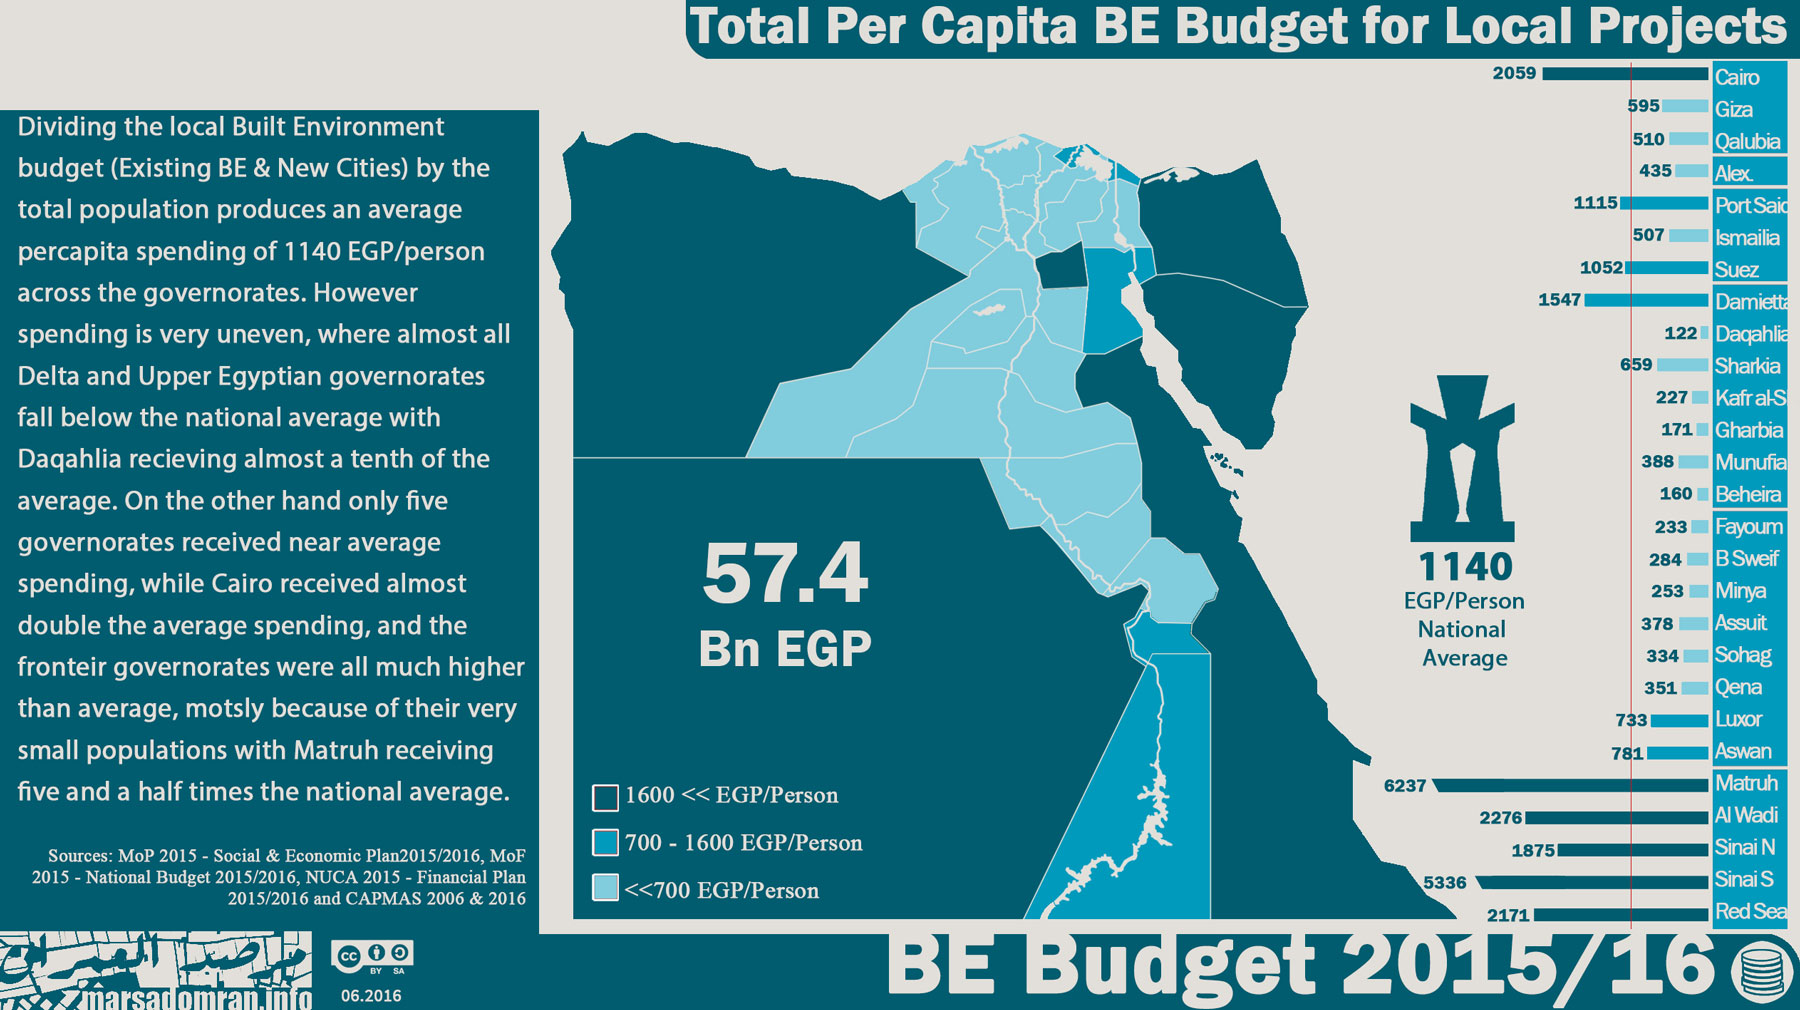
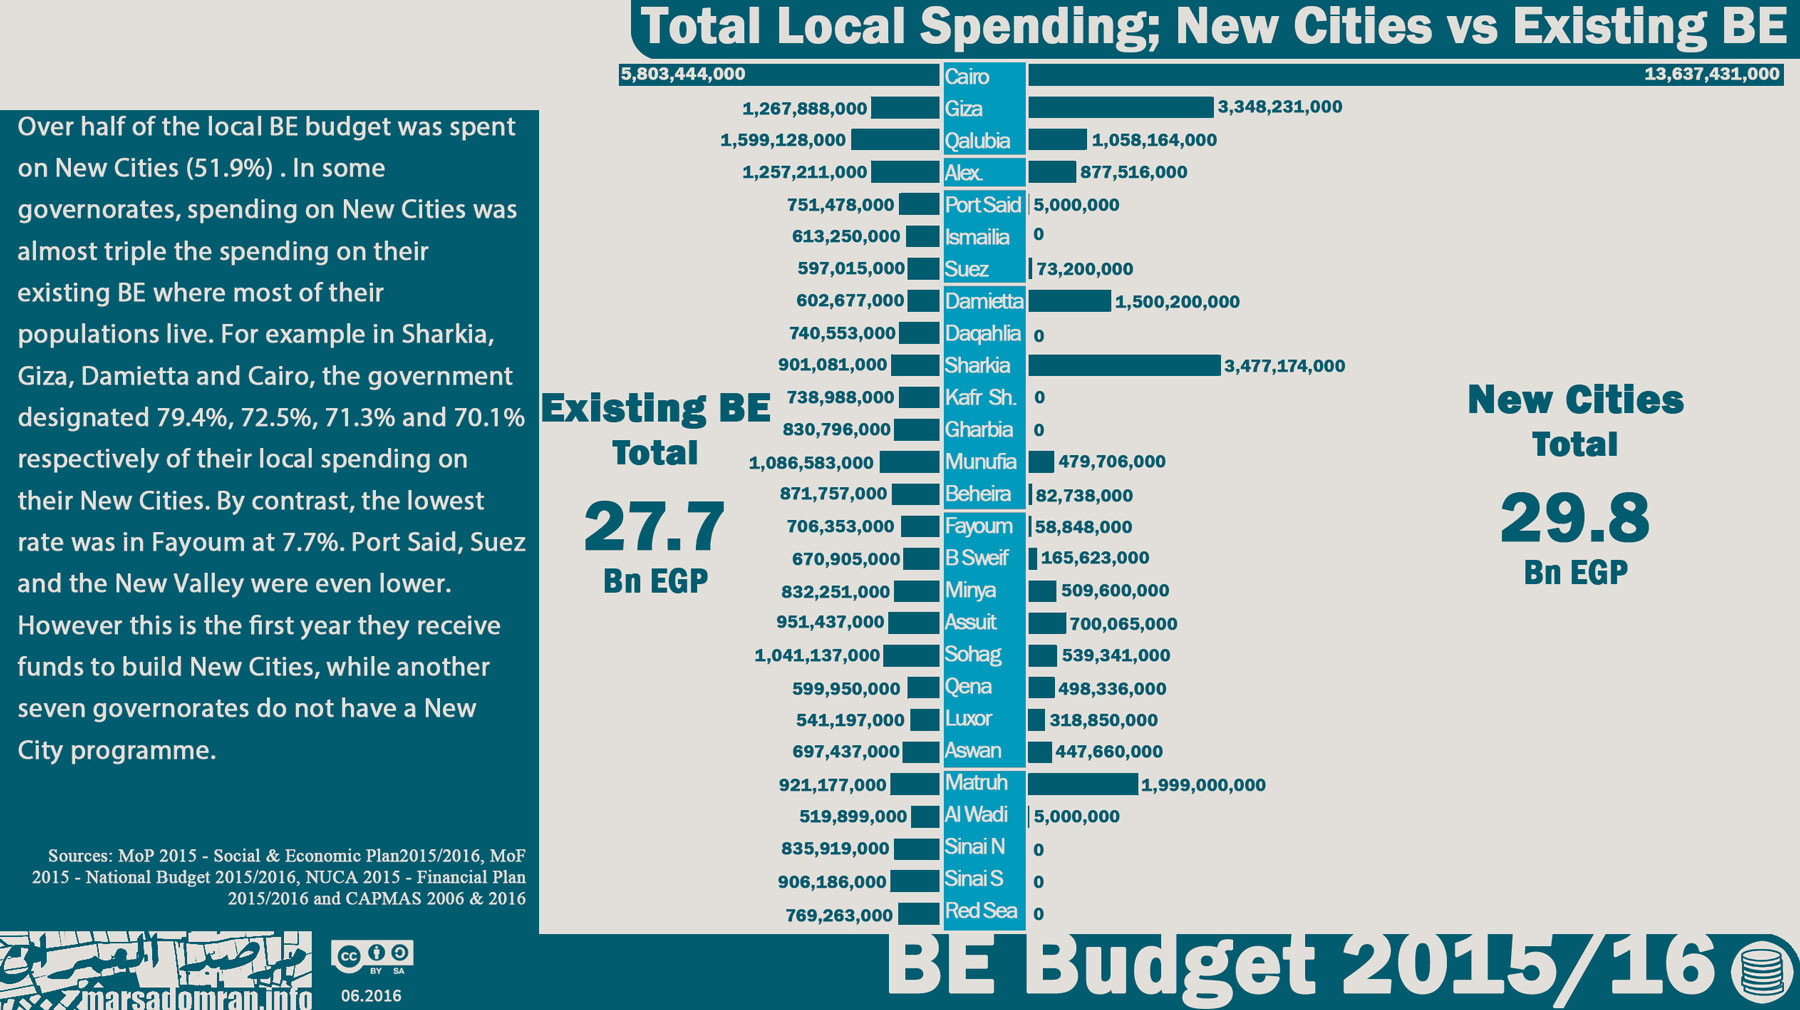
Local projects such as housing, water and waste-water plants, local transport and urban development made up 60% of the BE Budget. The rest were spent on regional projects such as power stations and networks, railroads and highways. Spending was almost equal between the two local administration structures particular to Egypt; the Existing Built Environment that includes over 200 cities and 4000 villages where almost 98% of Egyptians live, and the New Cities, about 31 desert new towns where about 2% of Egyptians live. This spatial inequity was revealed through per capita spending calculations which fluctuated between 322 EGP per person in the Existing BE, or about a third of the national average, to 15,537 EGP per person in New Cities, or about 15 times the national average.
Another measure of spatial inequity was how 7% of the BE Budget has been directed solely to two New Cities. The first is the New Administrative Capital in Cairo (5 Bn EGP), a government city being built from scratch. The second is New Alamein in Matruh (2 Bn EGP), a large coastal tourist resort. These investments are comparable to local investments for all sectors in Cairo’s Existing BE (5.8 Bn EGP), and are double those for the entire Matruh governorate (0.9 Bn EGP).
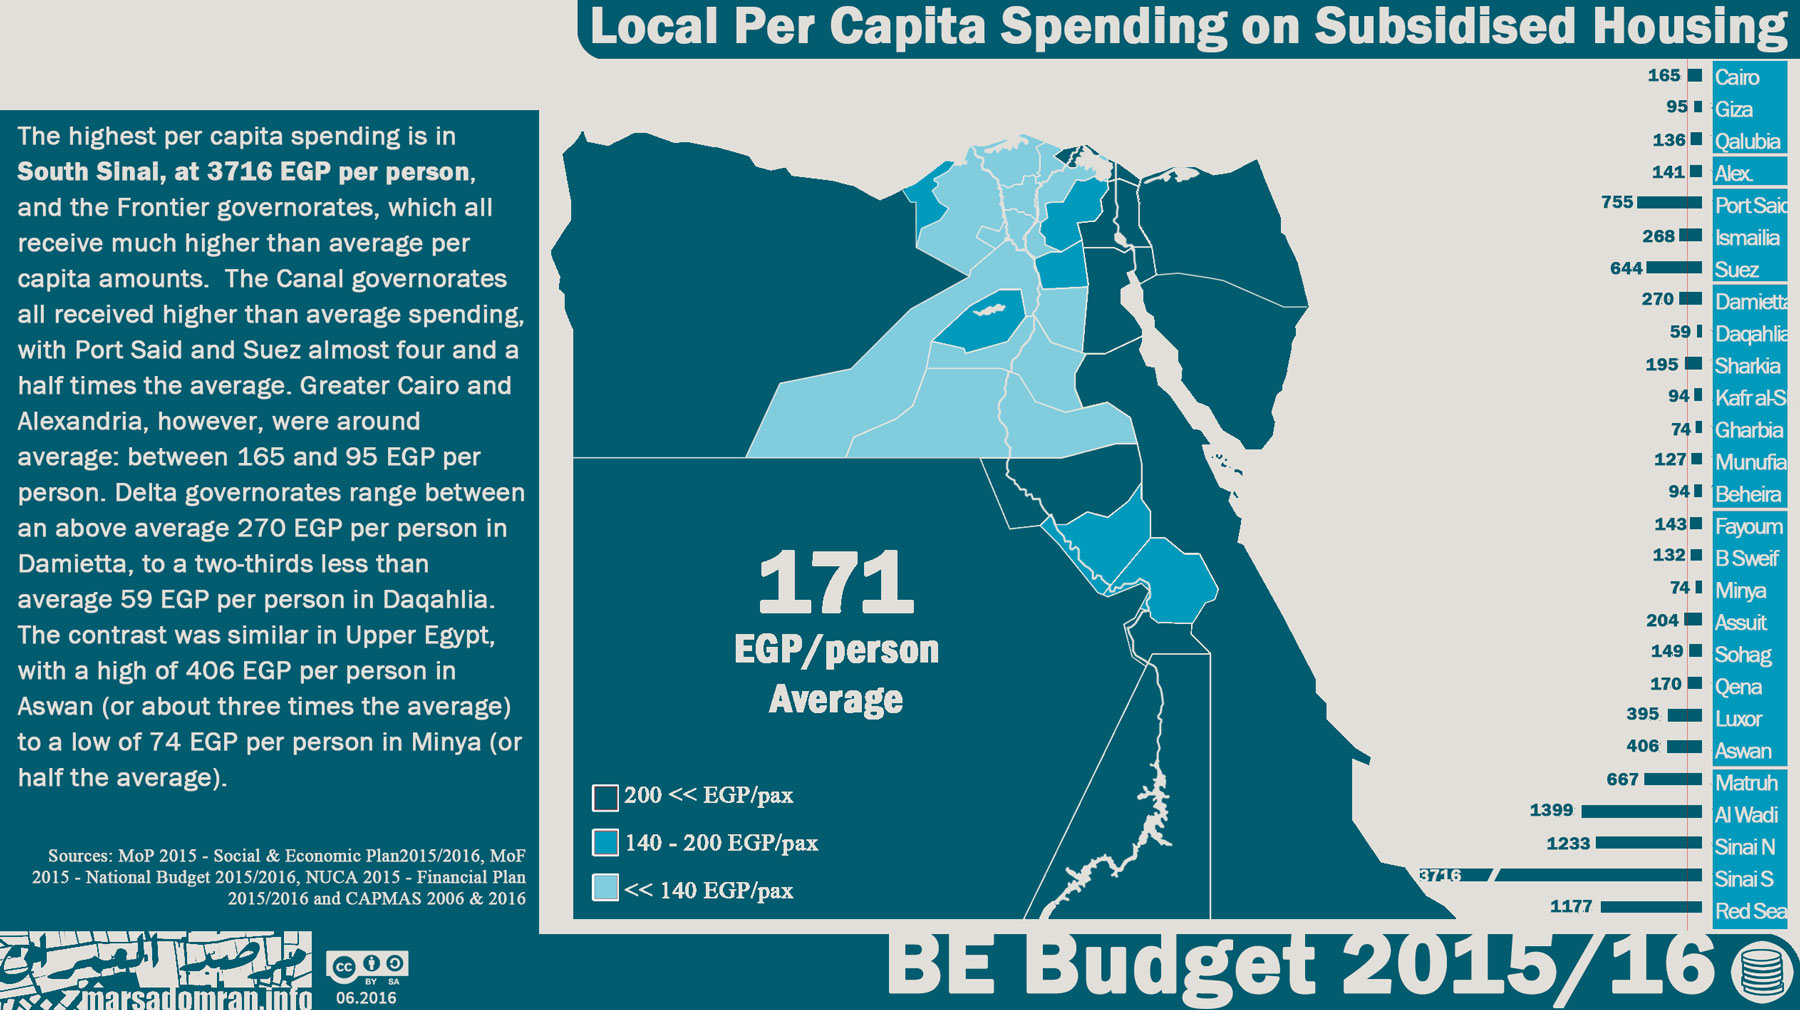
On the local level, our analysis has shown a wide spectrum of per capita spending across the regions in each sector (omitting spending on New Cities). The Frontier region received the highest per capita expenditure in all six sectors, with an average of 440 EGP per person, an attribute partially explained by their far below average population sizes as well as their above average areas. The Suez Canal region came second overall in per capita spending at 141 EGP per person. Greater Cairo was third amongst the regions in per capita spending at 63 EGP per person , with generally below average spending per sector. In fourth place was the predominantly rural Upper Egypt, at 45 EGP per person, of 35% of the national average. Alexandria, an urban governorate and Egypt’s third largest city, was, surprisingly, next to last at 44 EGP per person. The rual/industrial Delta was the region with the least per capita spending at 37 EGP per person, or 29% of the average overall per capita share.
All regions suffered from internal spending disparities, with one or two governorates receiving above or high above average spending in a number of sectors, while others receiving below or well below average per capita spending in most if not all sectors. This large fluctuation of per capita share of expenditure between the regions is evidence that not enough work has gone into basing spending on needs, where the two most deprived regions in Egypt, the Delta and Upper Egypt received much lower spending than the other regions, with the exception of Alexandria.
The BE Budget 2015/2016 concluded with a range of recommendations towards more equitable spending on the local level based on needs, as well as balancing the stark contrast between spending on New Cities and on the existing cities and villages. Short term solutions include writing an integrated need-based social and economic plan for each governorate. Medium and long term solutions advised vast administrative restructuring of the mostly national and sectoral agencies along local geographic lines, with the central government remaining in charge of regional projects and oversight of standards and plans at the local level.
Recommendations were also made on improving budget transparency and accessibility, calling for the release of budget data by programme and disaggregated by governorate and city/village three months prior to start of the financial year, as well as the release of Final Accounts data for each agency within three months of the end of financial year.
To download the study press here
To view the rest of the infographs continue below
Sectors & Administration

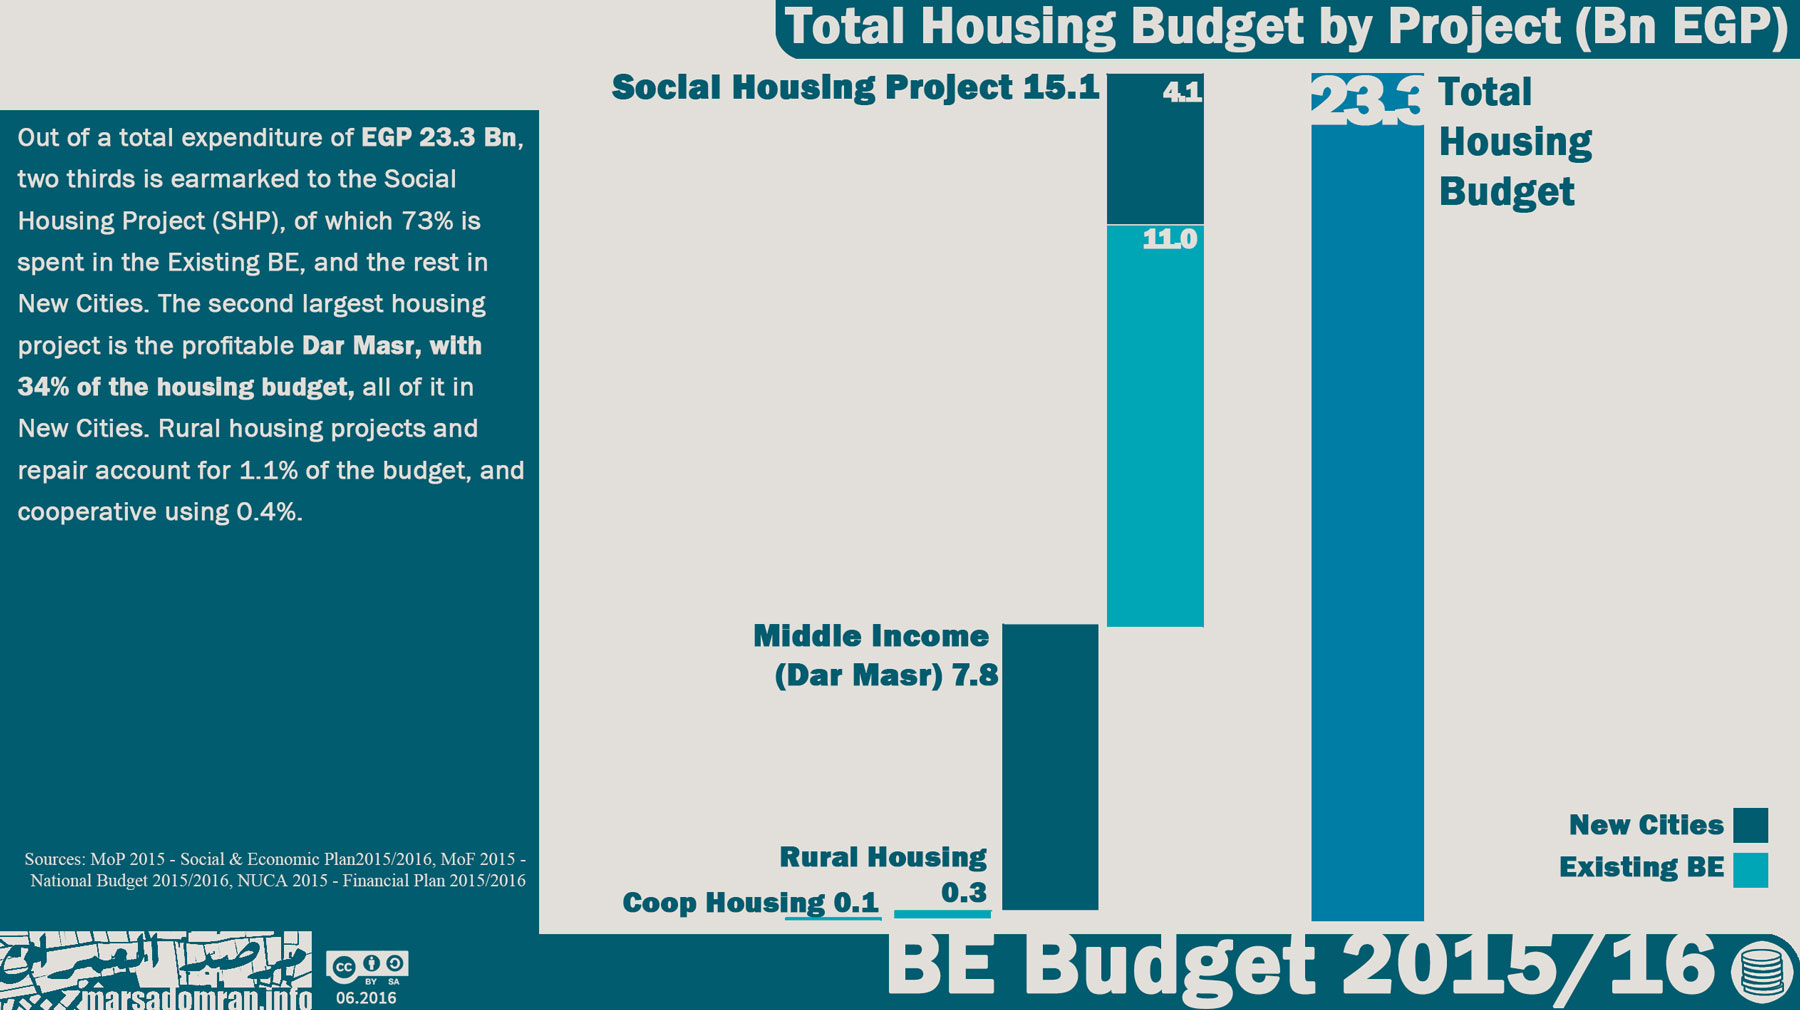
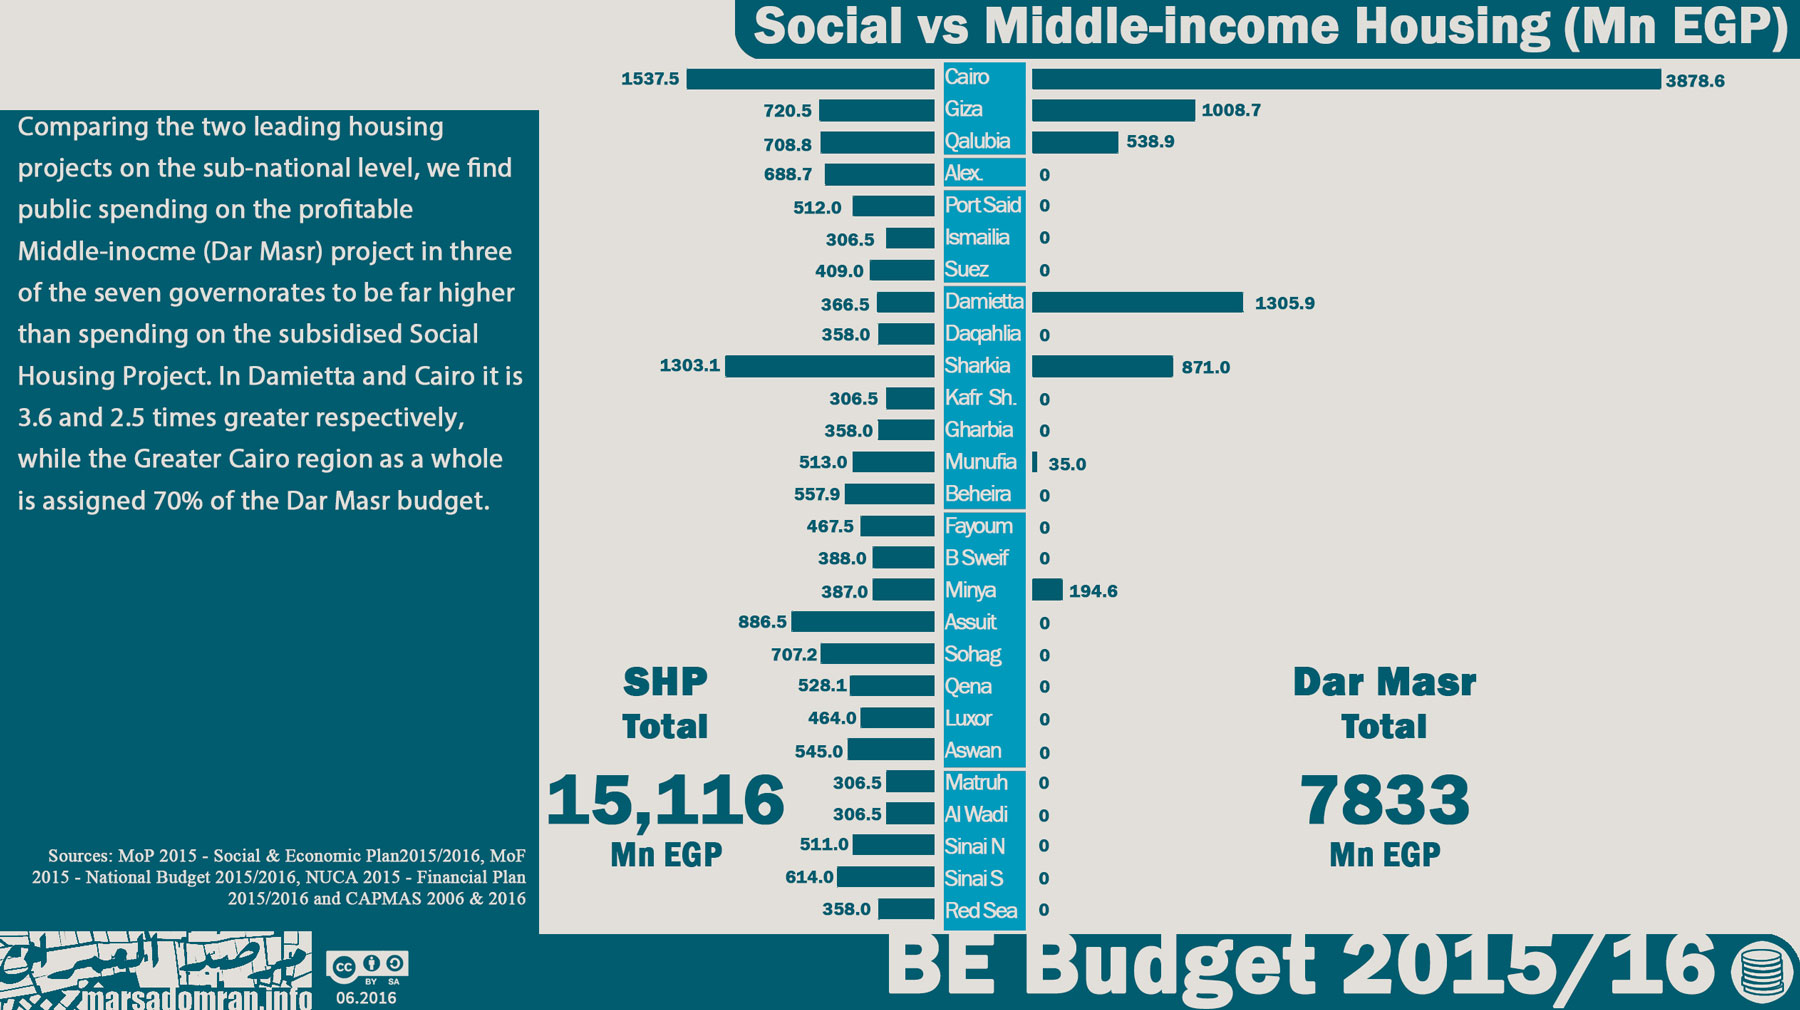
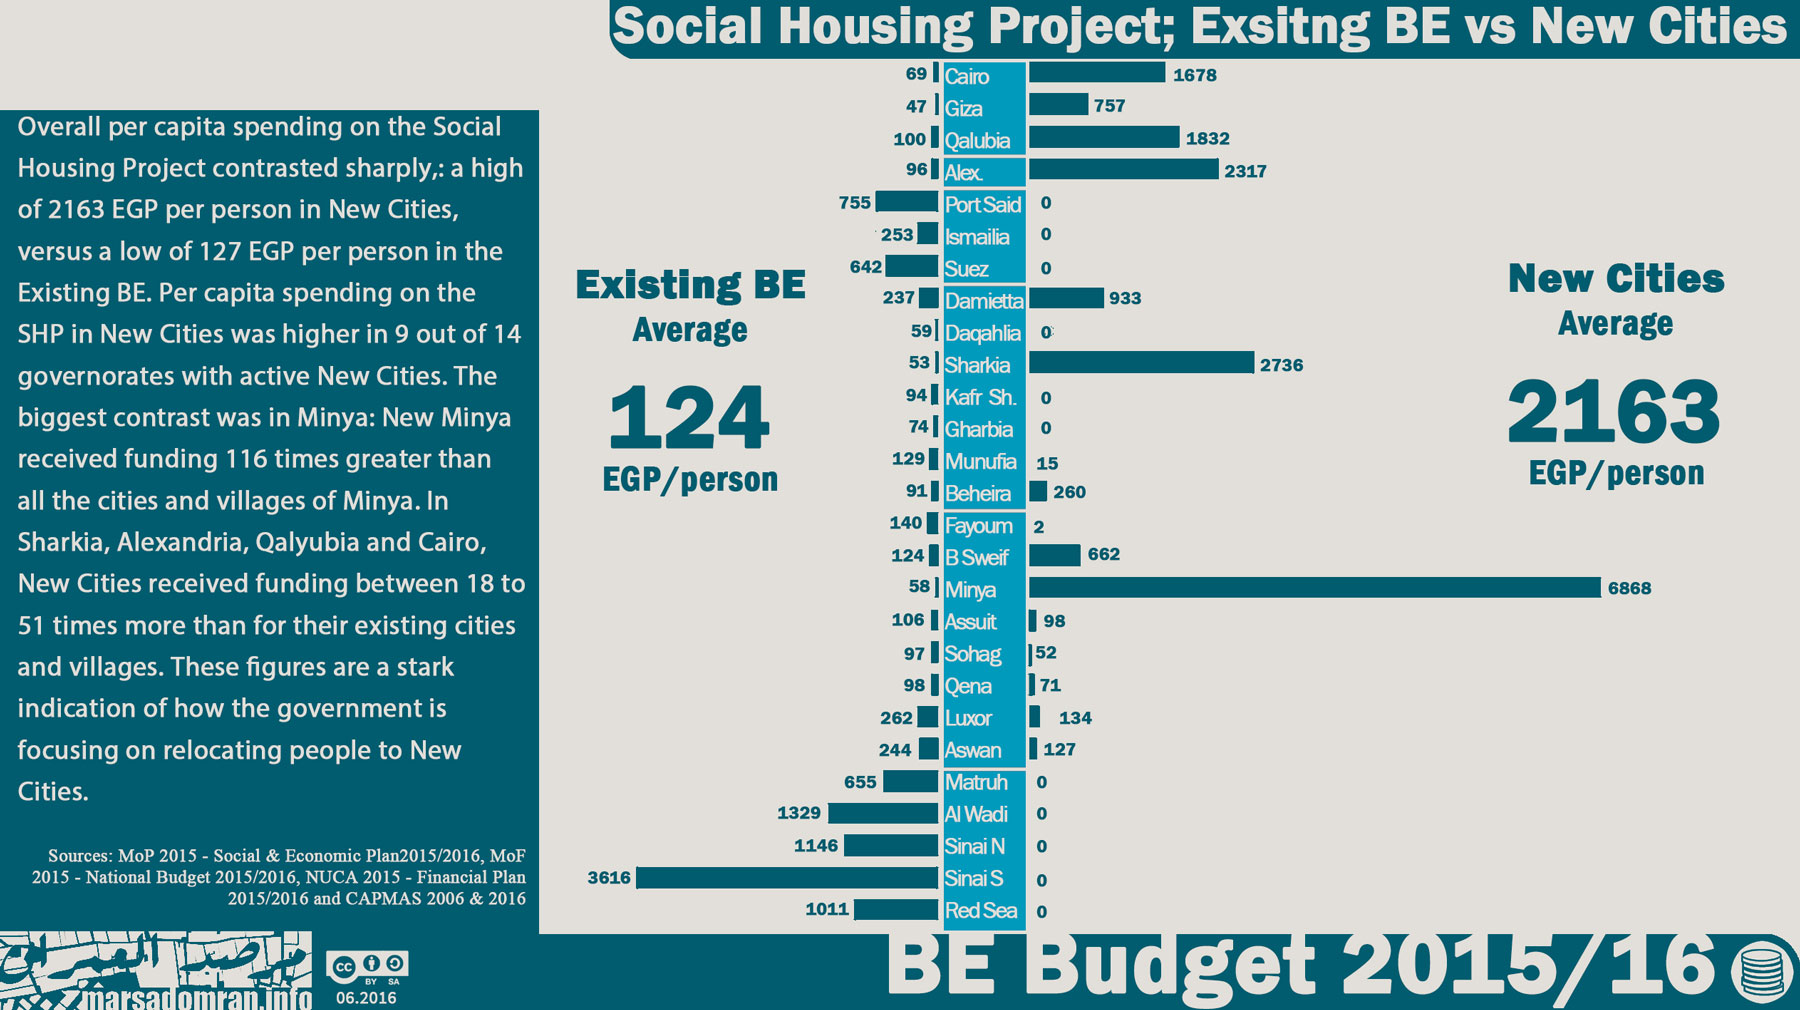
Housing
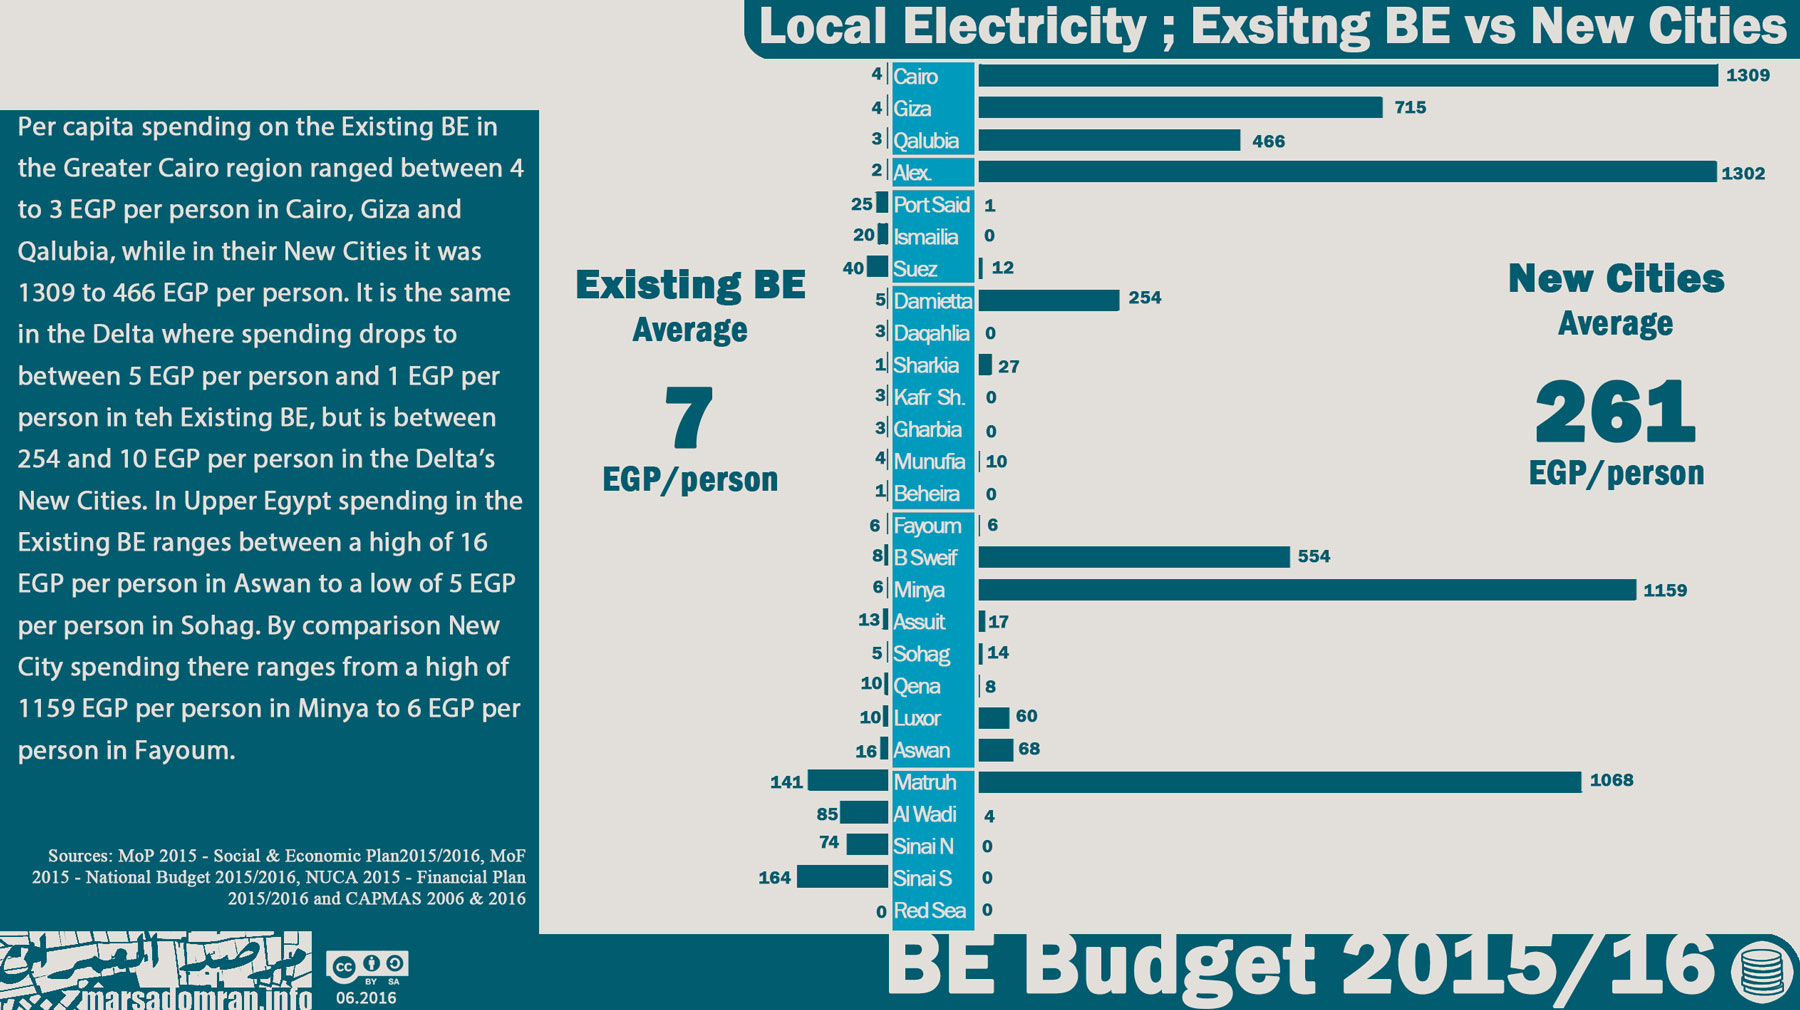
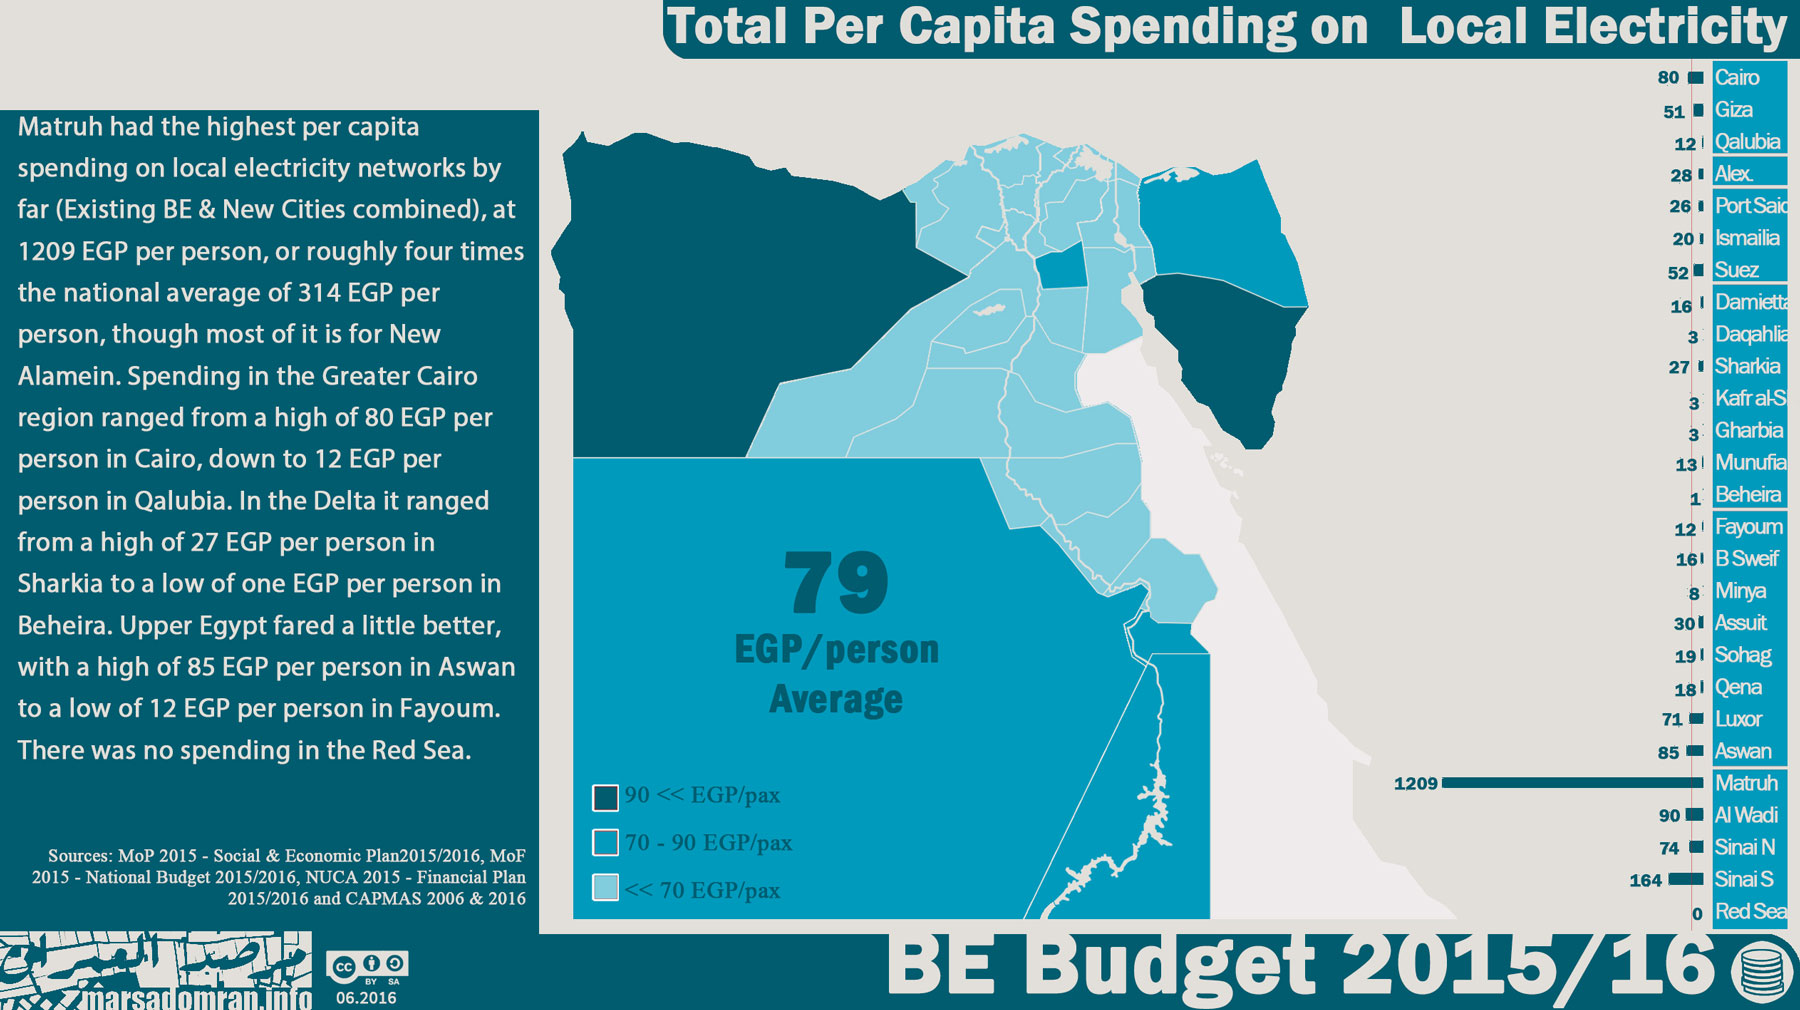
Electricity
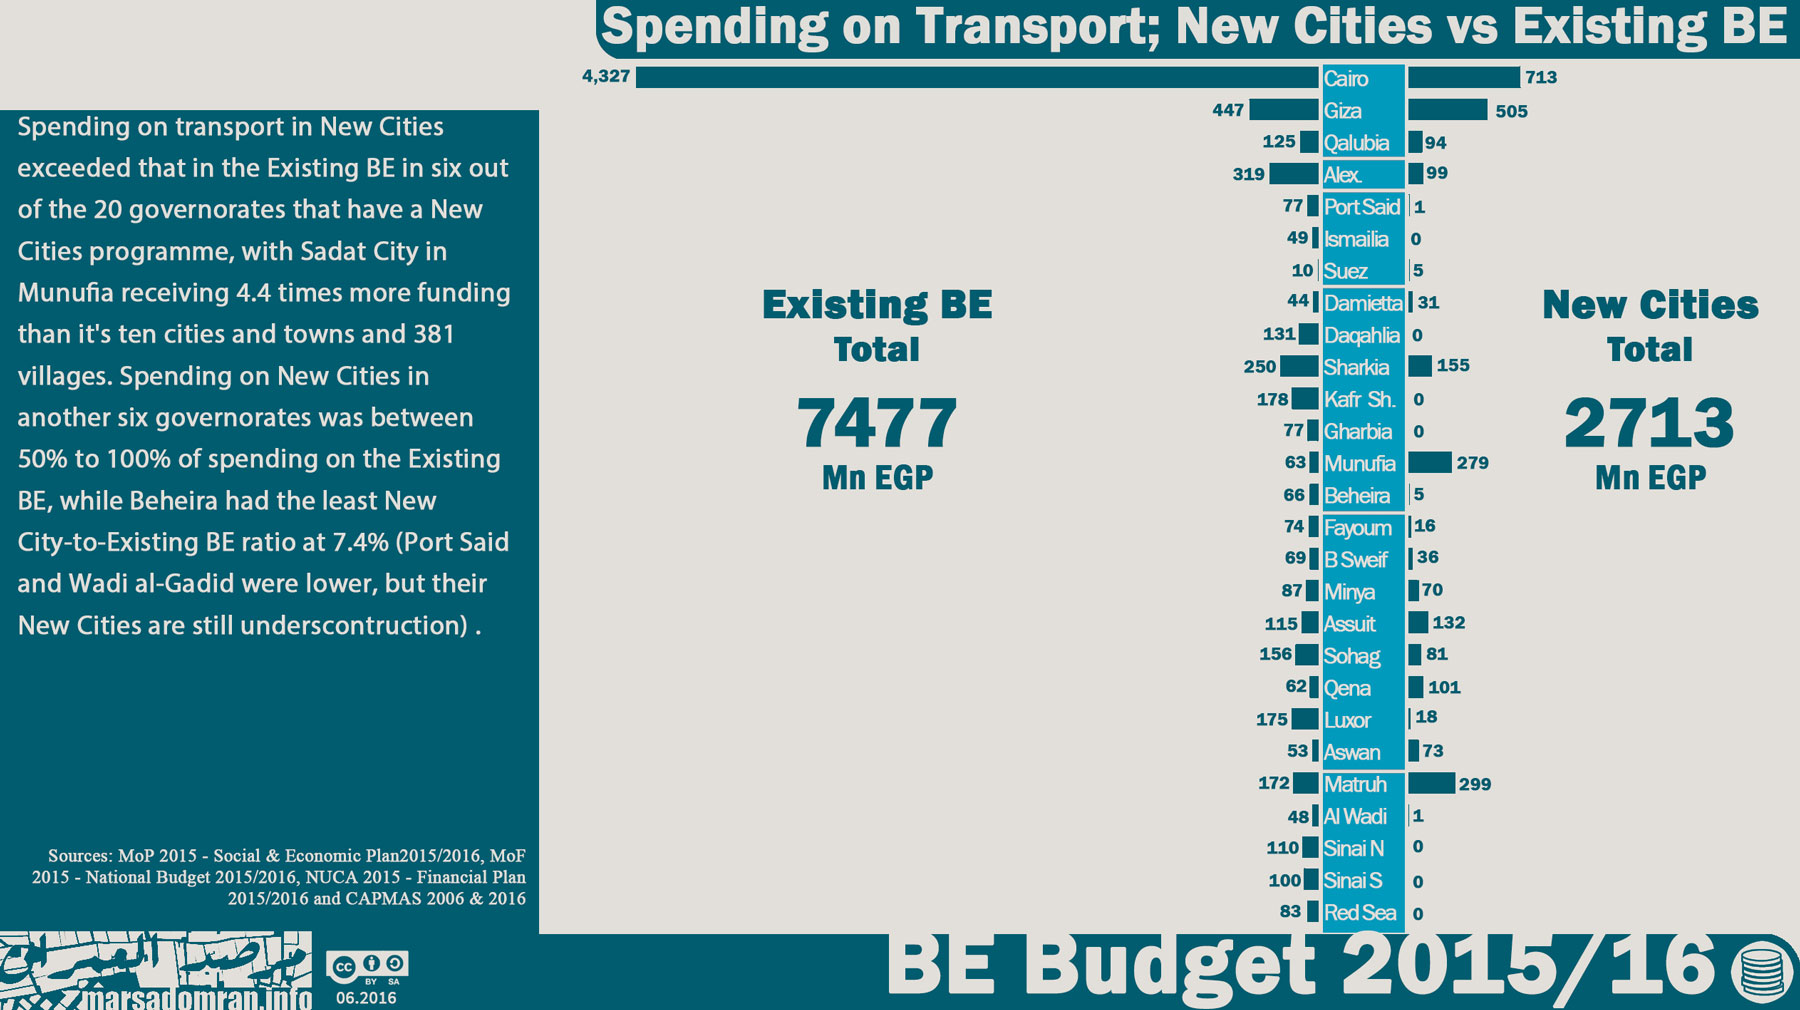
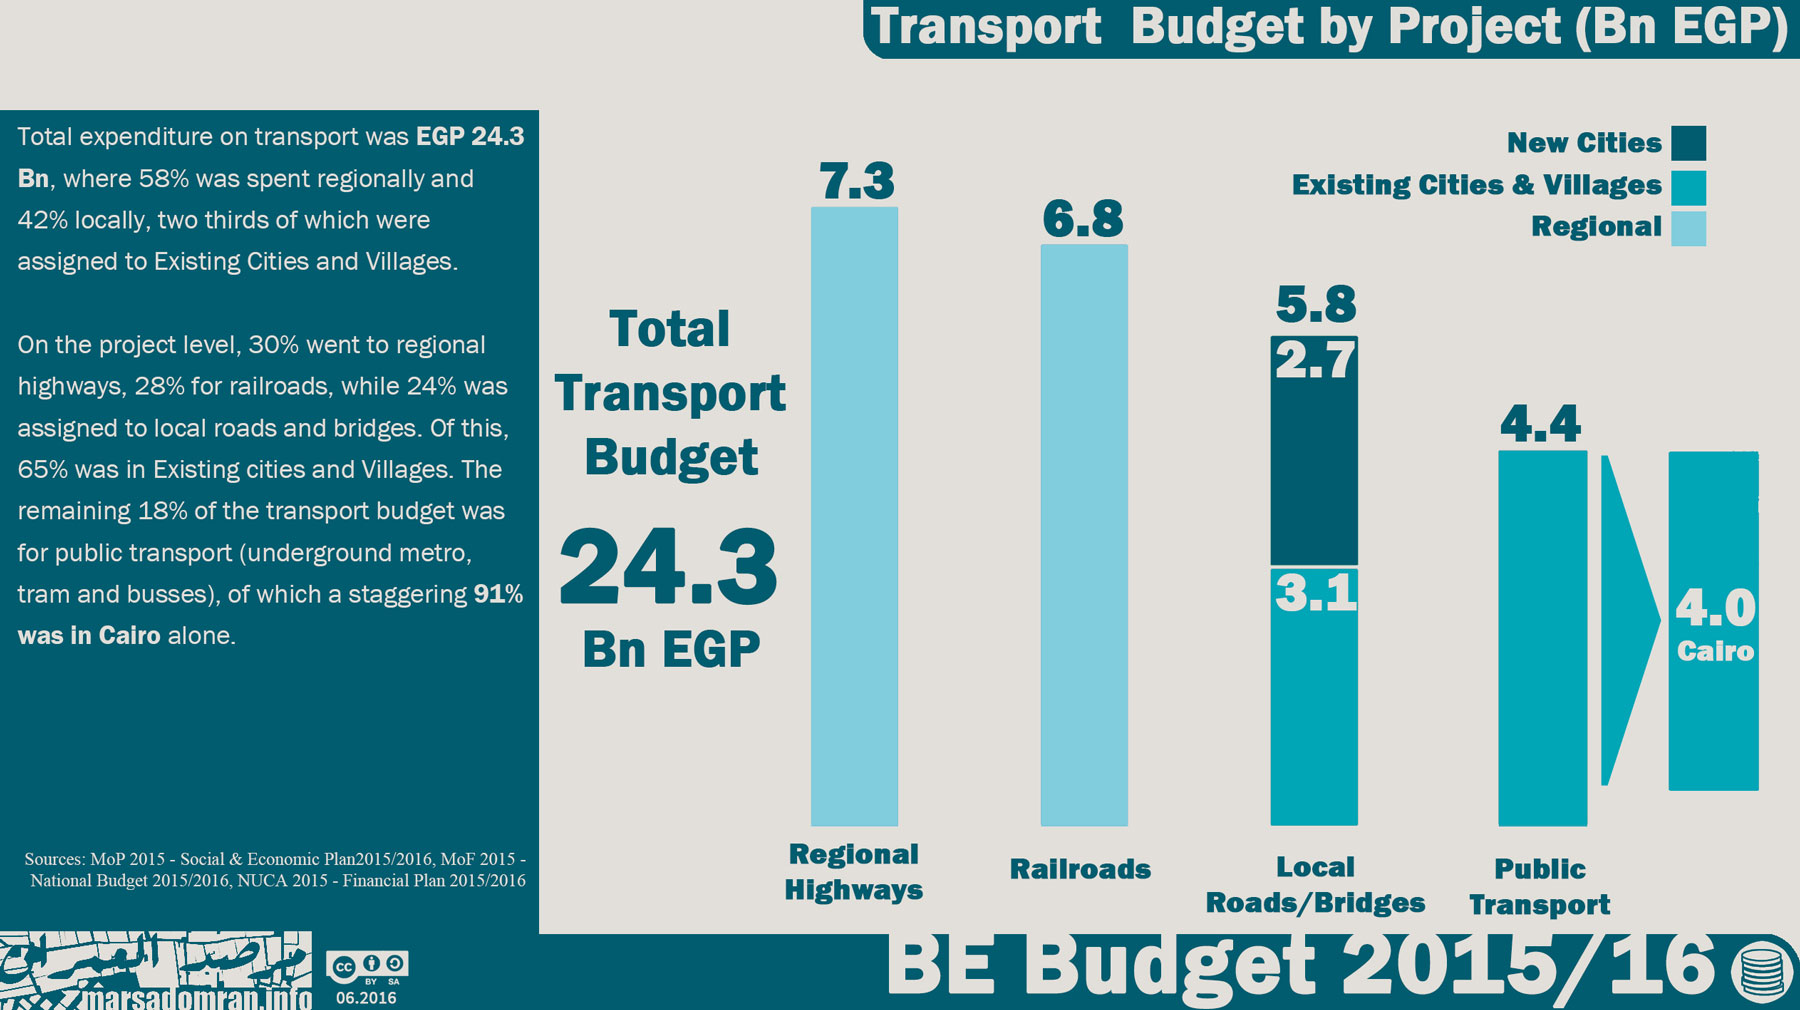
Transport
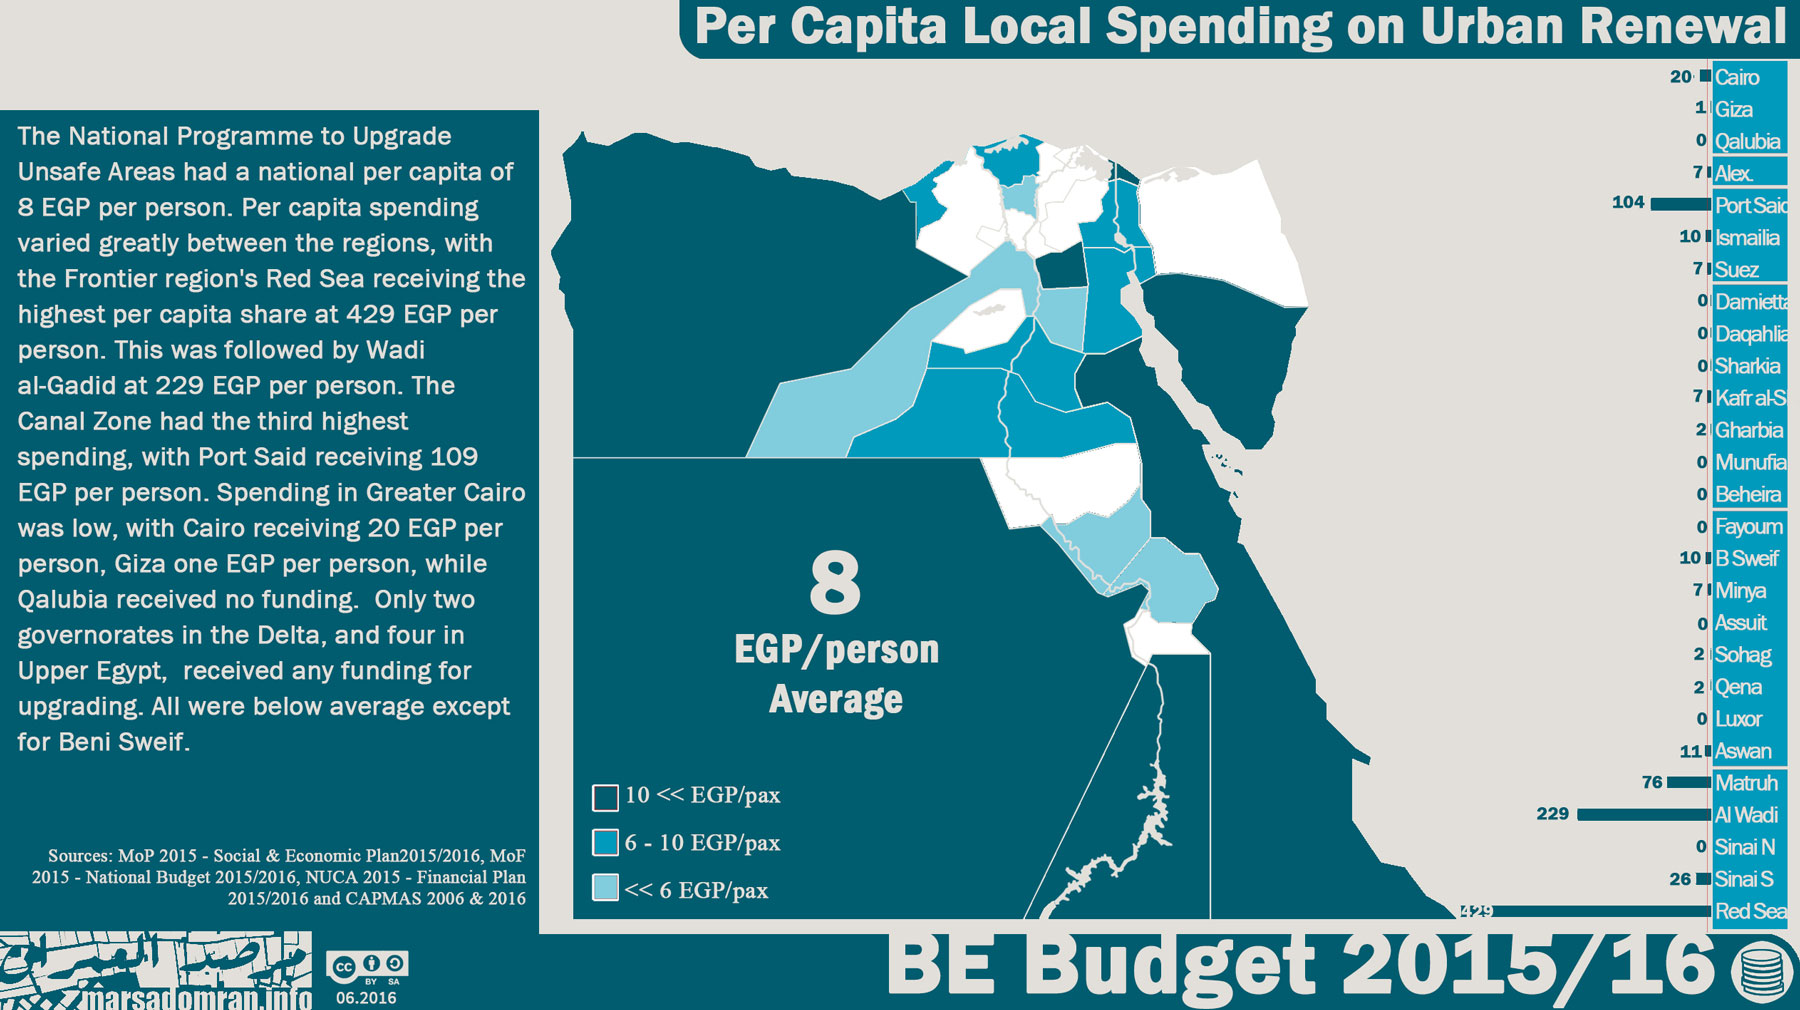
Urban Development
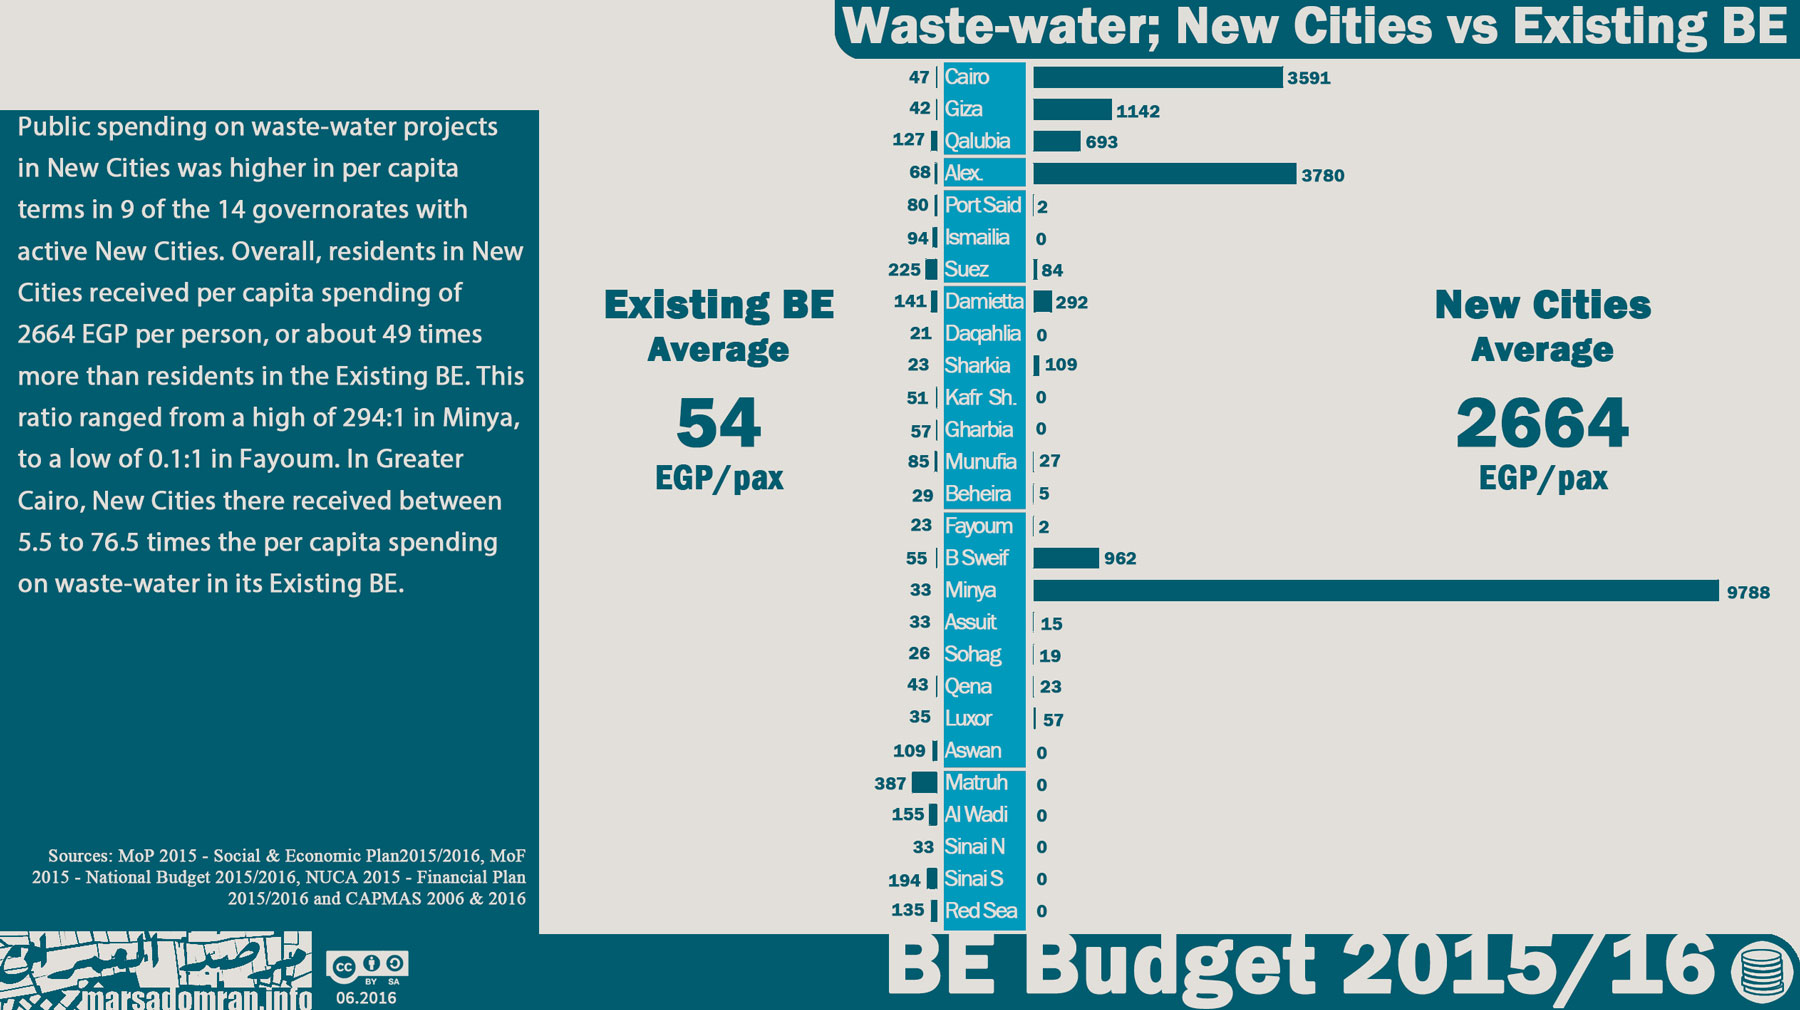
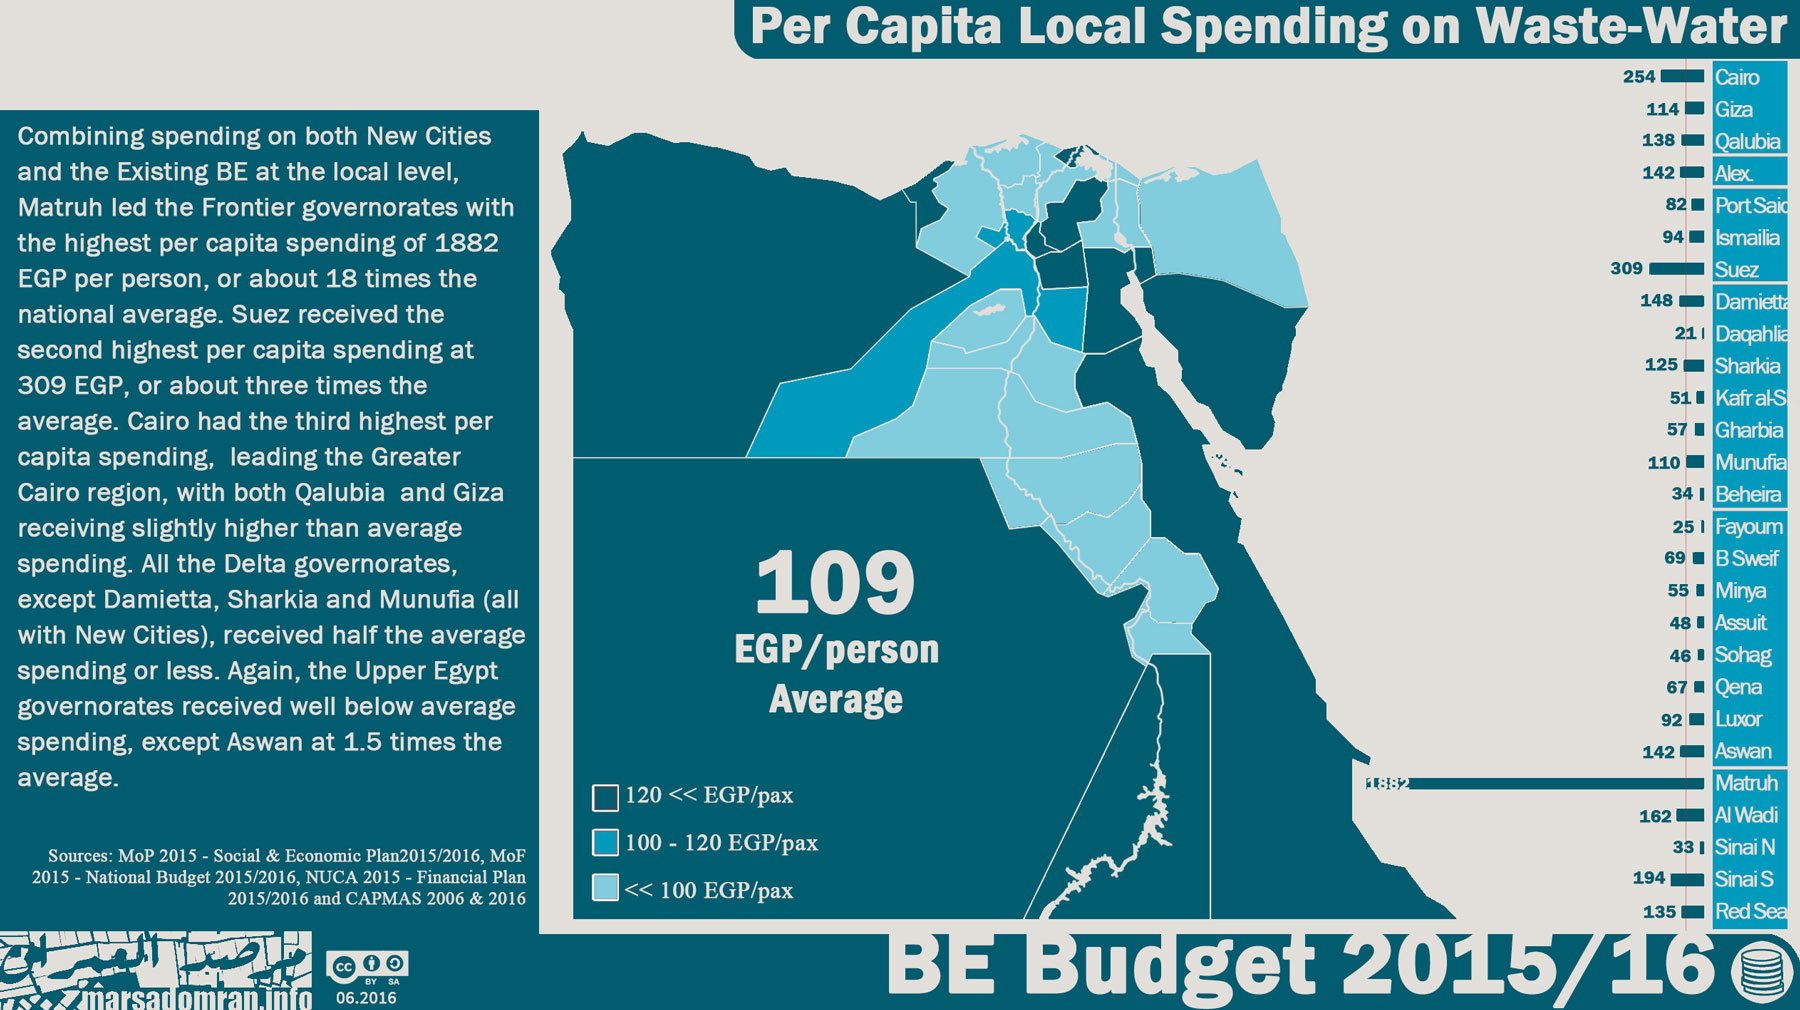
Waste-water
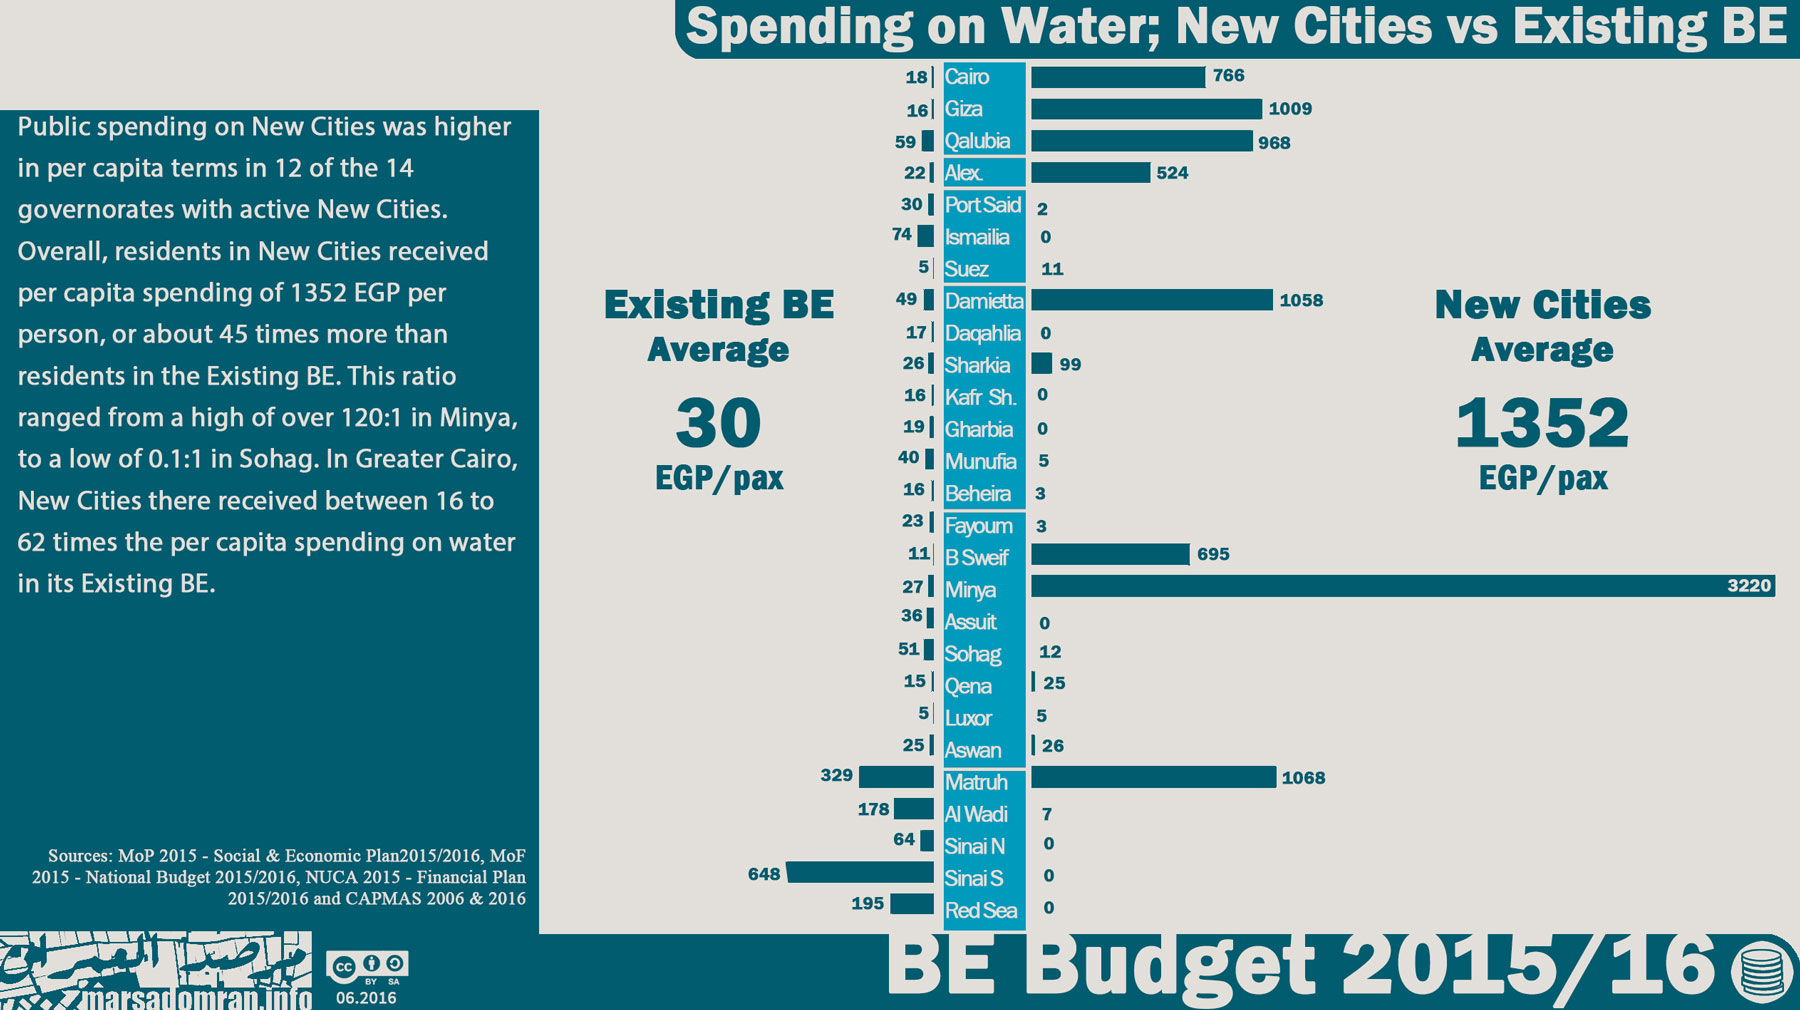
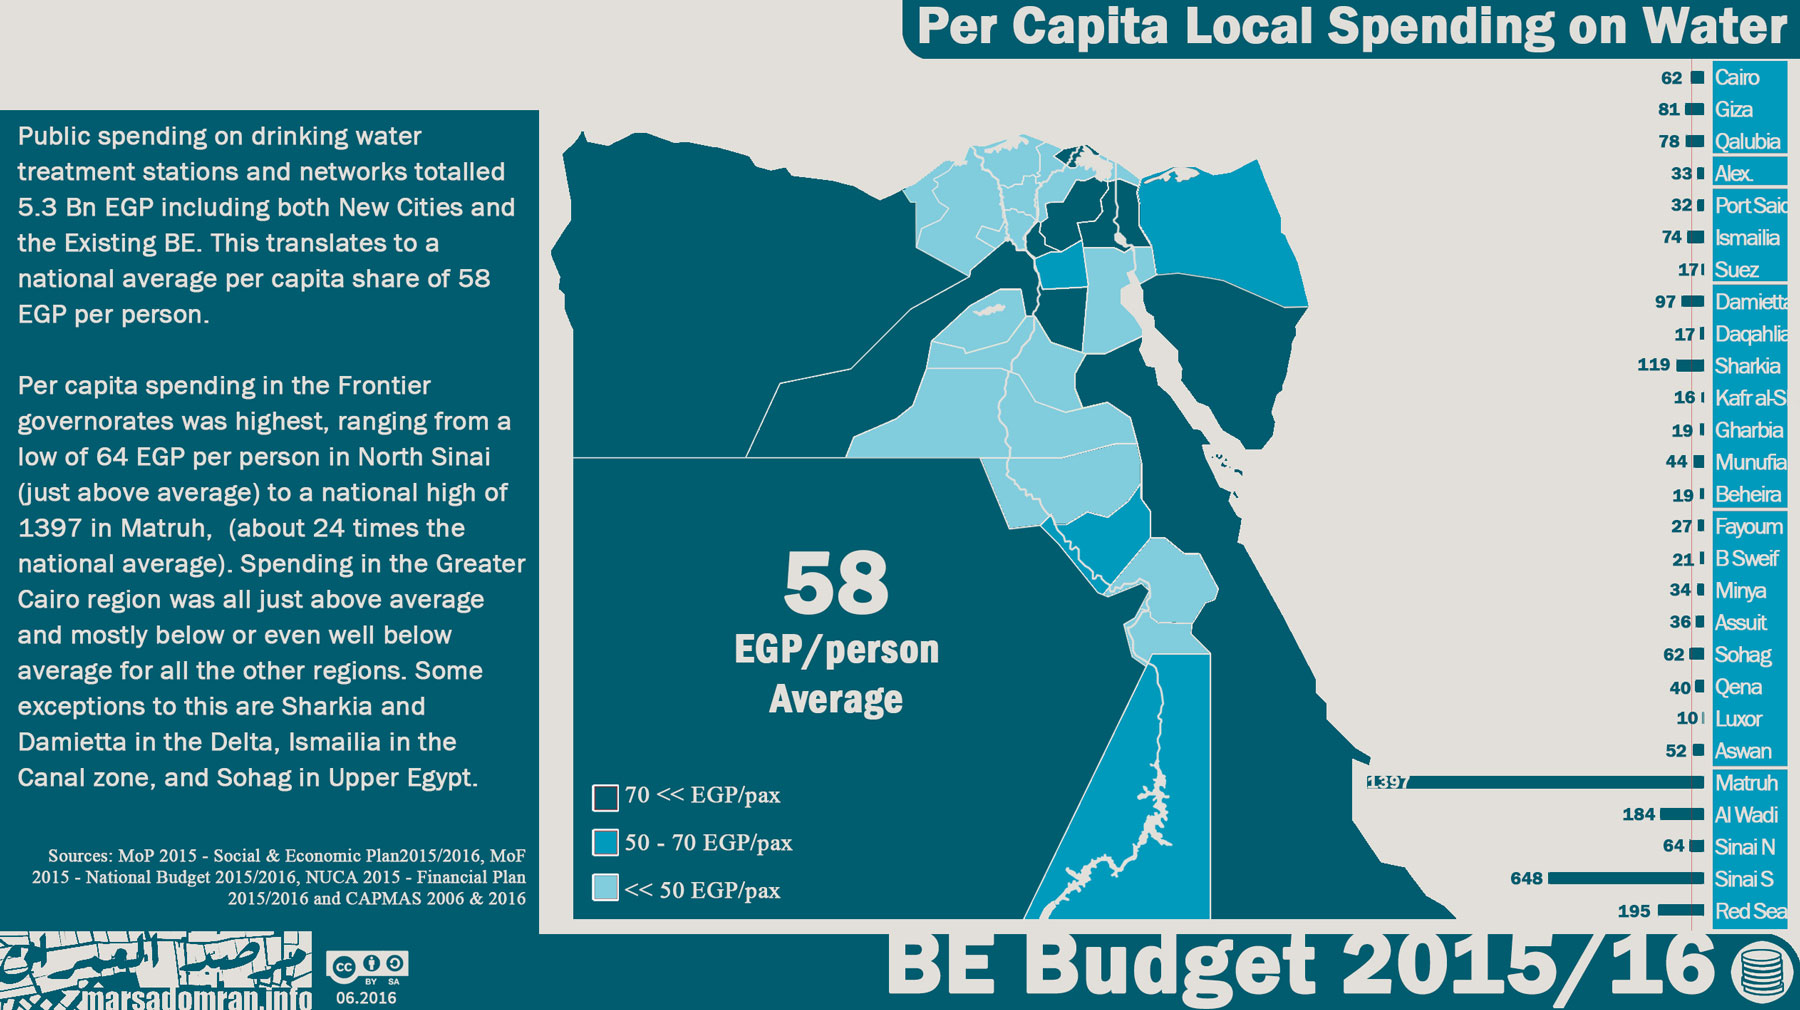
Water
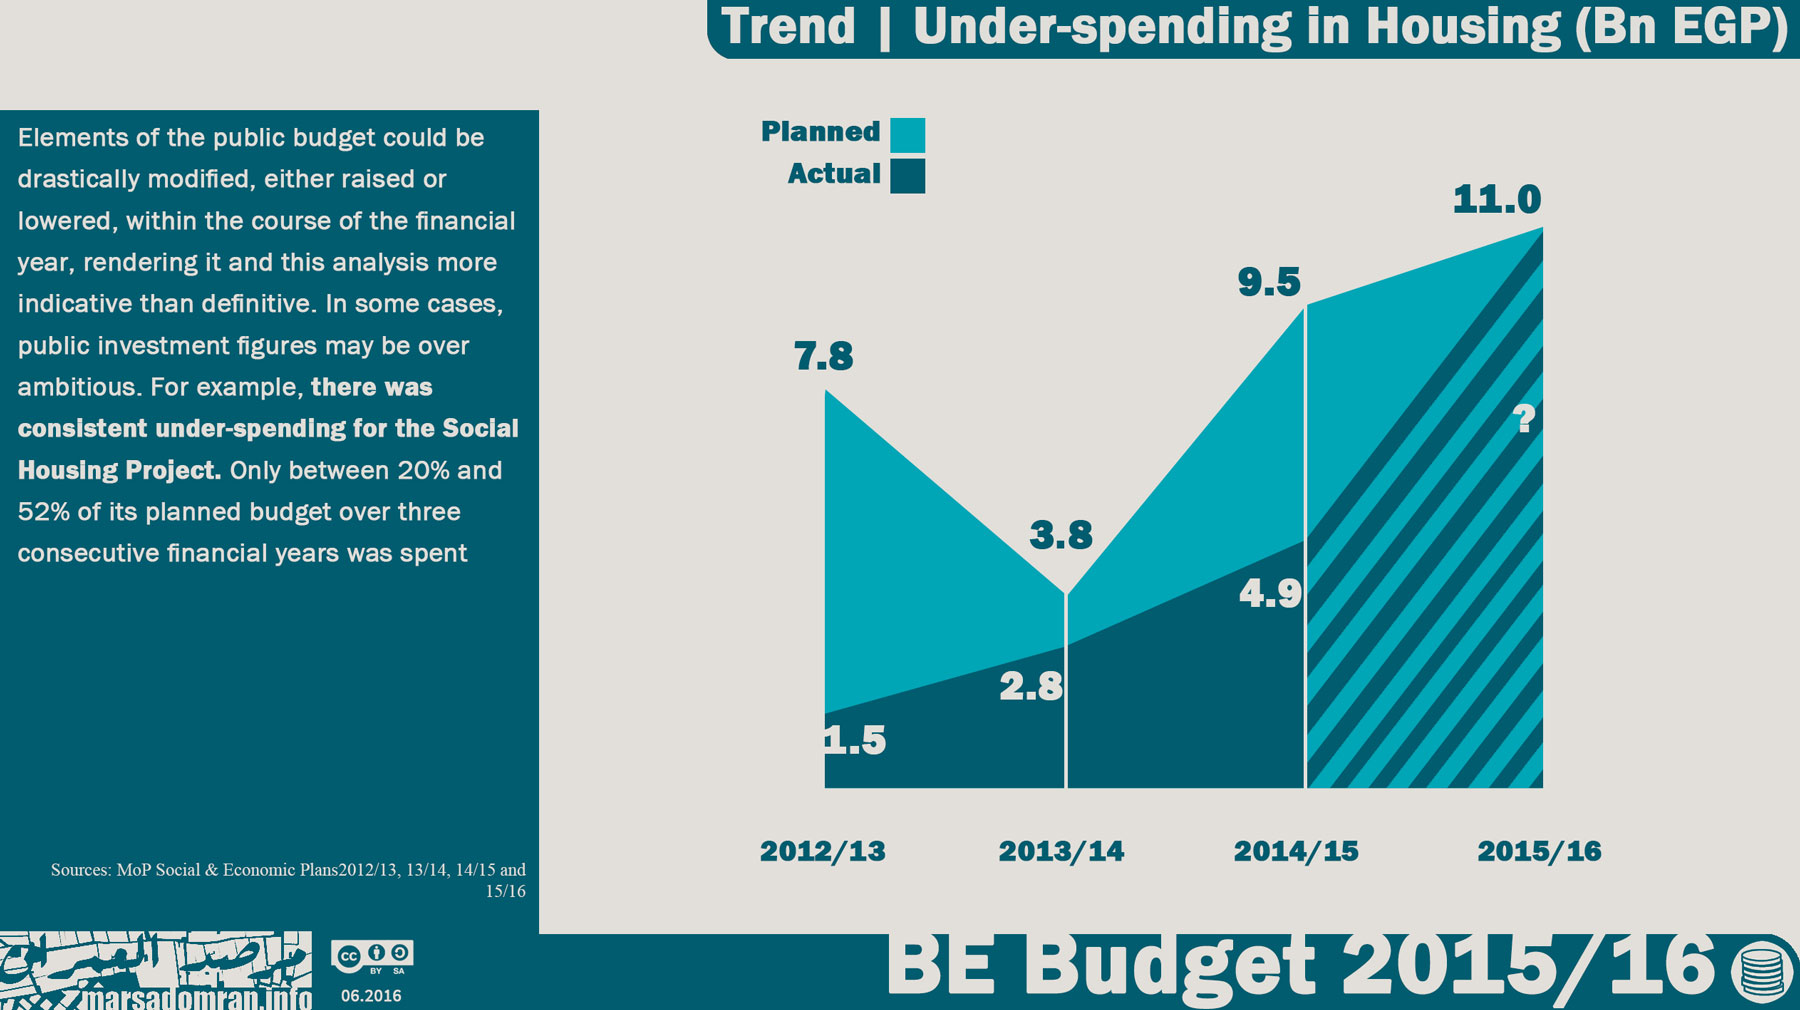
Under-spending